5.2. Capturing Blocking Events
Prior to SQL 2005, there were many scripts made available from various sources to capture what processes are blocking and what processes are being blocked. However, these scripts require manual execution. The sp_blocker (and its variation) is an example.
To configure Profiler, you only need the new SQL Trace event class listed below and must configure a threshold value in SQL Server for detecting blocking events.
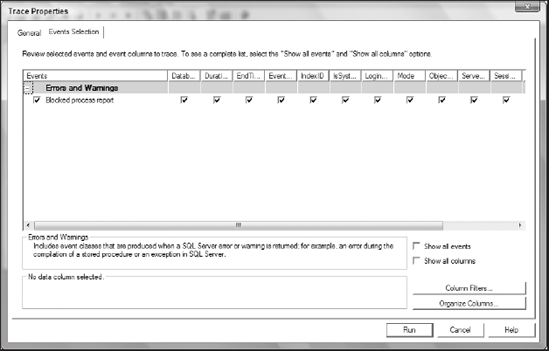
Blocked Process Report: This indicates that a task has been blocked for more than a specified amount of time. This event class does not include system tasks or tasks that are waiting on non–deadlock-detectable resources. Figure 5-5 is an example of this configuration.
Figure 5-5. Figure 5-5
To configure the threshold and frequency at which reports are generated, use the sp_configure command to configure the blocked process threshold option, which can be set in seconds. By default, no blocked process reports are produced. In the following code example, the blocked process threshold is configured to report the blocking event every 10 seconds. After the configuration, execute sp_configure again to verify the setting of "blocked process threshold" (see Figure 5-6).
sp_configure 'show advanced options', 1 GO RECONFIGURE GO -- The blocked process report threshold is the number of seconds the block is -- in effect after which you get an event ...
Get Professional SQL Server® 2005 Performance Tuning now with the O’Reilly learning platform.
O’Reilly members experience books, live events, courses curated by job role, and more from O’Reilly and nearly 200 top publishers.

