5.4. Capturing Deadlock Graphs
Because each process is preventing the other process from getting a required resource, a deadlock occurs when two SQL Server system process IDs (SPIDs) are waiting for a resource and neither process can proceed.
SQL Server has a lock manager thread that checks for deadlocks. When a deadlock is detected, in order to break the deadlock, the lock manager will choose one of the SPIDs as a victim. The lock manager then cancels the current batch for the victim, rolls back its transaction, and issues an error message as in the following example:
Transaction (Process ID 53) was deadlocked on lock resources with another
process and has been chosen as the deadlock victim. Rerun the transaction.
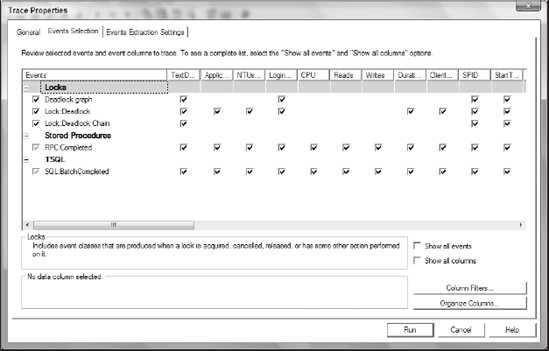
If deadlocks happen frequently, database applications suffer. SQL Server Profiler can create a trace to capture deadlock events for analysis. Use the following event classes to configure a Profiler trace (also, see Figure 5-11):
Lock:Deadlock Chain: Monitors when deadlock conditions occur.
Lock:Deadlock: Identifies which SPID was chosen as the deadlock victim.
Deadlock Graph: Provides an XML description of a deadlock. This class occurs simultaneously with the Lock:Deadlock event class.
RPC:Completed: Indicates that a remote procedure call has been completed.
SQL:BatchCompleted: Indicates that the Transact-SQL batch has completed.
Figure 5-11. Figure 5-11
To simulate a ...
Get Professional SQL Server® 2005 Performance Tuning now with the O’Reilly learning platform.
O’Reilly members experience books, live events, courses curated by job role, and more from O’Reilly and nearly 200 top publishers.

