11.3. Pipeline Performance Monitoring
In the last chapter, one of the things you looked at was the built-in Pipeline logging functionality and how it could help you understand what Integration Services was doing behind the scenes when running a package with one or more Data Flows. Another tool available to Integration Services is the Windows operating system tool called Performance Monitor (PerfMon for short), which is available to local administrators in the machine's Administrative Tools. When Integration Services is installed on a machine, a set of counters is added that allows the tracking of the Data Flow's performance.
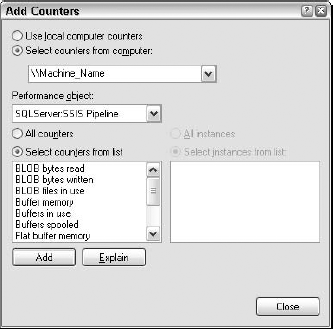
As Figure 11-20 shows, the Pipeline counters can be used when selecting the SQLServer:SSIS Pipeline object.
Figure 11.20. Figure 11-20

The following counters are available in the SQLServer:SSIS Pipeline object within PerfMon. Descriptions of these counters are provided below.
BLOB bytes read
BLOB bytes written
BLOB files in use
Buffer memory
Buffers in use
Buffers spooled
Flat buffer memory
Flat buffers in use
Private buffers in use
Rows read
Rows written
The BLOB counters help identify the volume of the BLOB data types flowing through the Data Flow. Since handling large binary columns can be a huge drain on the available memory, understanding how your Data Flow is handling BLOB data types becomes important. Remember that BLOB data can be introduced to the Data Flow ...
Get Professional SQL Server™ 2005 Integration Services now with the O’Reilly learning platform.
O’Reilly members experience books, live events, courses curated by job role, and more from O’Reilly and nearly 200 top publishers.

