Chapter 40
Using the Debugging Windows
WHAT’S IN THIS CHAPTER?
- Learning basic debugging concepts in Visual Studio, including breakpoints and DataTips
- Understanding the debugging windows in Visual Studio
- Using and unwinding exceptions during a debug session
Debugging an application is one of the more challenging tasks developers must tackle, but correct use of the Visual Studio 2012 debugging windows can help you analyze the state of the application and determine the cause of any bugs. This chapter examines the numerous windows available in Visual Studio 2012 to support you in building and debugging applications.
THE CODE WINDOW
The most important window for debugging purposes is the code window. With the capability to set breakpoints and step through code, this window is the starting point for almost all debugging activities. Figure 40-1 shows a simple snippet of code with both a breakpoint and the current execution point visible.
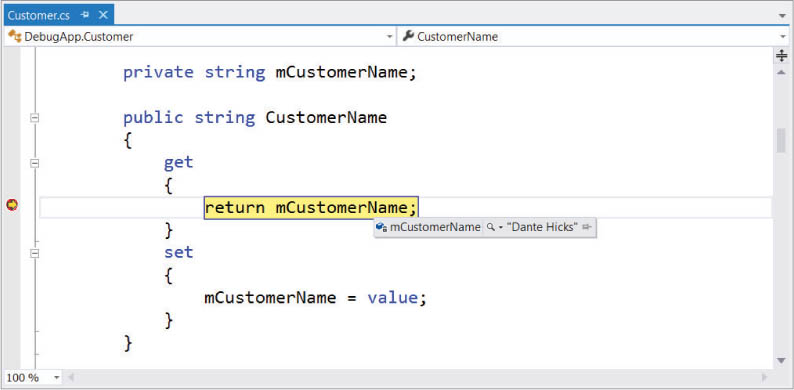
Breakpoints
The first stage in debugging an application is usually to identify the area causing the error by setting a breakpoint and gradually stepping through the code. The next chapter covers in detail setting breakpoints and working with the current execution point. Breakpoints are marked in the code window with a red dot in the margin of the page and a colored highlighting of the code itself.
When a breakpoint is encountered, the current ...
Get Professional Visual Studio 2012 now with the O’Reilly learning platform.
O’Reilly members experience books, live events, courses curated by job role, and more from O’Reilly and nearly 200 top publishers.

