Chapter 40Using the Debugging Windows
Wrox.com Code Downloads for this Chapter
The wrox.com code downloads for this chapter are found at www.wrox.com/go/professionalvisualstudio2015 on the Download Code tab. The code and any related support files are located in their own folder for this chapter.
Debugging an application is one of the more challenging tasks developers must tackle, but correct use of the Visual Studio 2015 debugging windows can help you analyze the state of the application and determine the cause of any bugs. This chapter examines the numerous windows available in Visual Studio 2015 to support you in building and debugging applications.
The Code Window
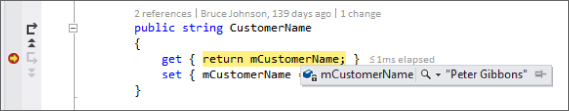
The most important window for debugging purposes is the code window. With the capability to set breakpoints and step through code, this window is the starting point for almost all debugging activities. Figure 40.1 shows a simple snippet of code with both a breakpoint and the current execution point visible.
Breakpoints
The first stage in debugging an application is usually to identify the area causing the error by setting a breakpoint and gradually stepping through the code. The next chapter covers in detail setting breakpoints ...
Get Professional Visual Studio 2015 now with the O’Reilly learning platform.
O’Reilly members experience books, live events, courses curated by job role, and more from O’Reilly and nearly 200 top publishers.

