You may recall that in the Chapter 6, Spatial Processing we ran several tools to utilize the zonal histogram answer to the distribution of terrains (Landcover) in a buffered pipeline corridor. Open a new QGIS project and load in the Pipeline layer and the Landcover.
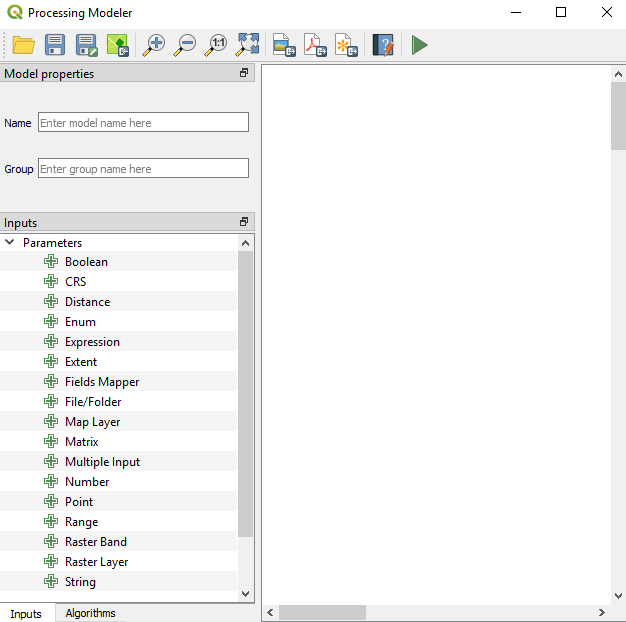
To create a model, go to Processing | Graphical Modeler to open the modeler, where we can select from different Inputs and Algorithms for our model. Graphical Modeler is shown in the following screenshot:

Select the Inputs tab and choose Vector Layer. Add a new parameter called Pipeline and set Geometry type to Line; this is shown in the following ...

