Creating histograms and density plots
In this recipe, you will learn how to make histograms and density plots, which are useful to look at the distribution of values in a dataset.
How to do it...
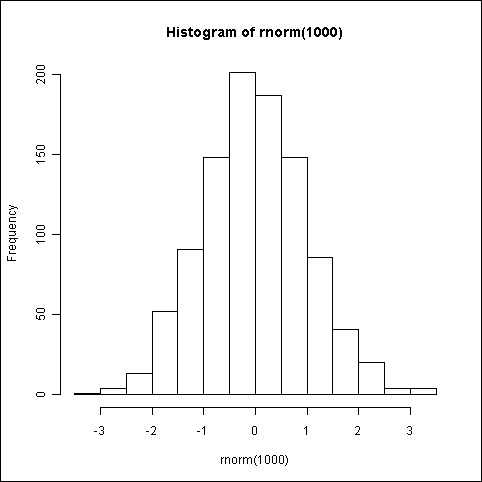
The simplest way to demonstrate the use of a histogram is to show a normal distribution:
hist(rnorm(1000))

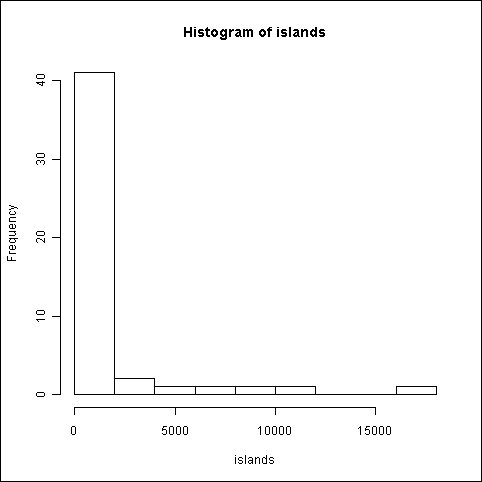
Another example of a histogram is one that shows a skewed distribution:
hist(islands)

How it works...
The
hist() function is also a function of R's base graphics library. It takes only one compulsory argument, that is, the variable whose distribution of values ...
Get R: Data Analysis and Visualization now with the O’Reilly learning platform.
O’Reilly members experience books, live events, courses curated by job role, and more from O’Reilly and nearly 200 top publishers.

