Creating pairs plots
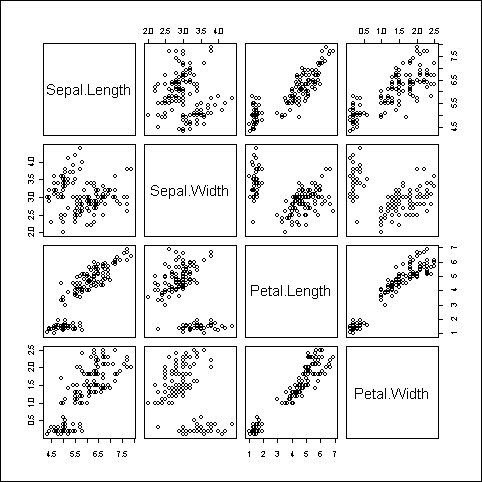
A pairs plot is a matrix of scatter plots and is a very handy visualization to quickly scan the correlations between many variables in a dataset.
How to do it...
We will use the built-in iris dataset, which gives the measurements in centimeters of the sepal length and sepal width, and petal length and petal width variables, respectively, for 50 flowers from each of three species of iris:
pairs(iris[,1:4])

How it works...
As you can see in the preceding figure, the pairs() command makes a matrix of scatter plots, where all the variables in the specified dataset are plotted against each other. The variable names, displayed in the diagonal ...
Get R: Data Analysis and Visualization now with the O’Reilly learning platform.
O’Reilly members experience books, live events, courses curated by job role, and more from O’Reilly and nearly 200 top publishers.

