Displaying the data density on axes
In this recipe, we will learn how to show the density of data points on a scatter plot in the margin of the X or Y axes.
Getting ready
For this recipe, we don't need to load any additional libraries.
How to do it...
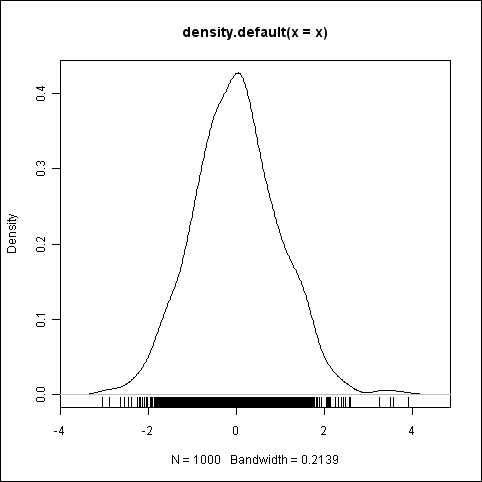
We will use the rug() function in the base graphics library. As a simple example to illustrate the use of this function, let's see the data density of a normal distribution:
x<-rnorm(1000)
plot(density(x))
rug(x)

How it works...
As can be seen from this example, the rug() function adds a set of lines just above the x-axis. A line or tick mark is placed wherever there is a point at that particular X location. ...
Get R: Data Analysis and Visualization now with the O’Reilly learning platform.
O’Reilly members experience books, live events, courses curated by job role, and more from O’Reilly and nearly 200 top publishers.

