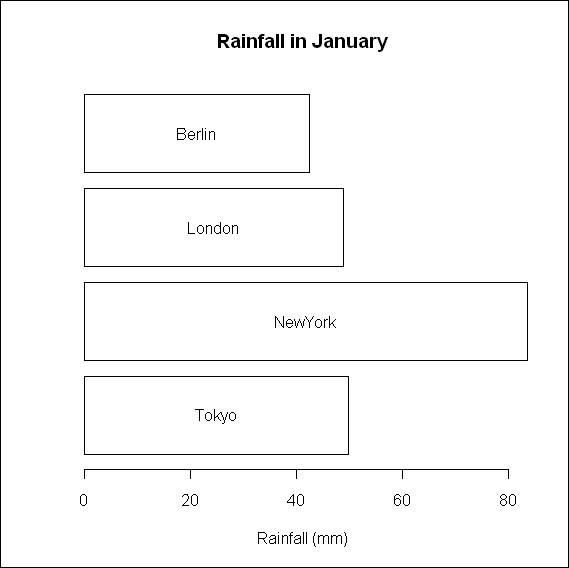
Placing labels inside bars
Sometimes, we might wish to label bars by placing text inside the bars instead of using a legend. In this recipe, we will learn how to do this based on code, similar to the previous recipe.
Getting ready
We will use the cityrain.csv example dataset. We don't need to load any additional packages for this recipe.
How to do it...
We will plot the rainfall in the month of January in four cities as a horizontal bar chart:
rain<-read.csv("cityrain.csv")

y<-barplot(as.matrix(rain[1,-1]),horiz=T,col="white",
yaxt="n",main=" Rainfall in January",xlab="Rainfall (mm)")

x<-0.5*rain[1,-1]
text(x,y,colnames(rain[-1]))
How it works...
The
Get R: Data Analysis and Visualization now with the O’Reilly learning platform.
O’Reilly members experience books, live events, courses curated by job role, and more from O’Reilly and nearly 200 top publishers.

