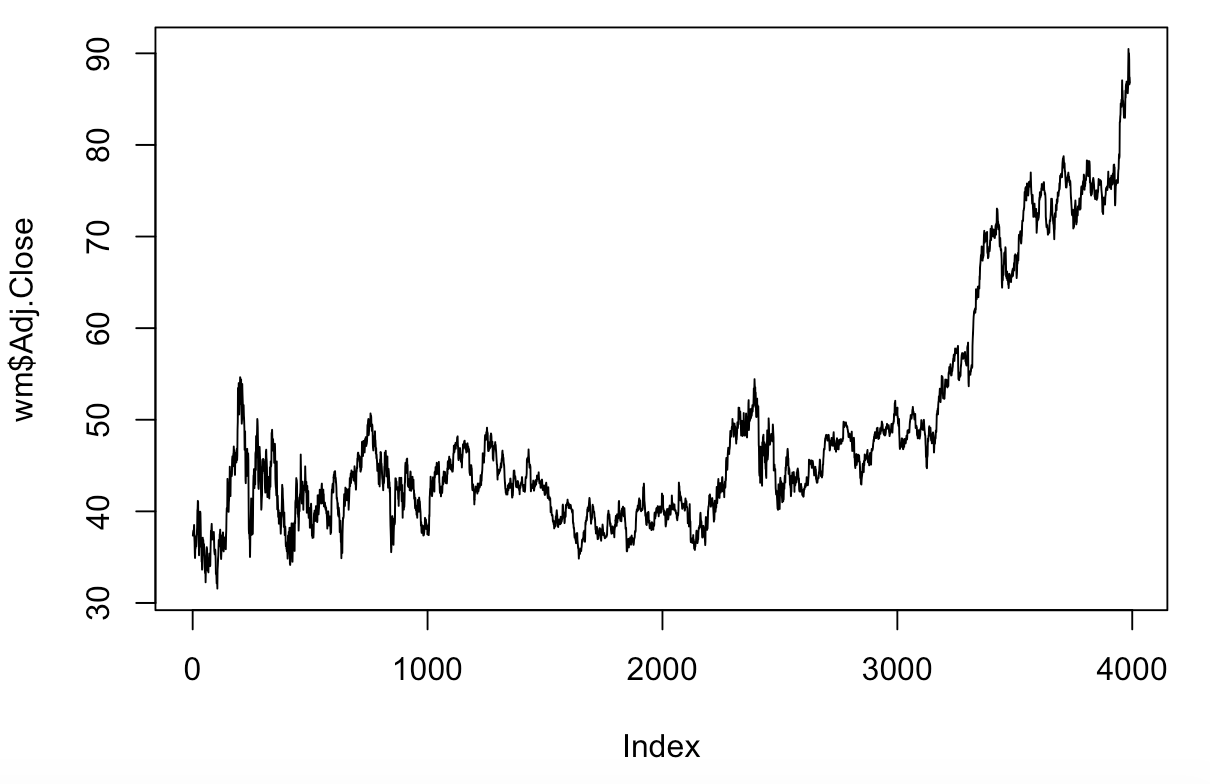
- Read the file. We will use a data file that has the share prices of Walmart (downloaded from Yahoo Finance) between March 11, 1999 and January 15, 2015:
> wm <- read.csv("walmart.csv")
- View the data as a line chart:
> plot(wm$Adj.Close, type = "l")
The data can be viewed as a line chart as follows:
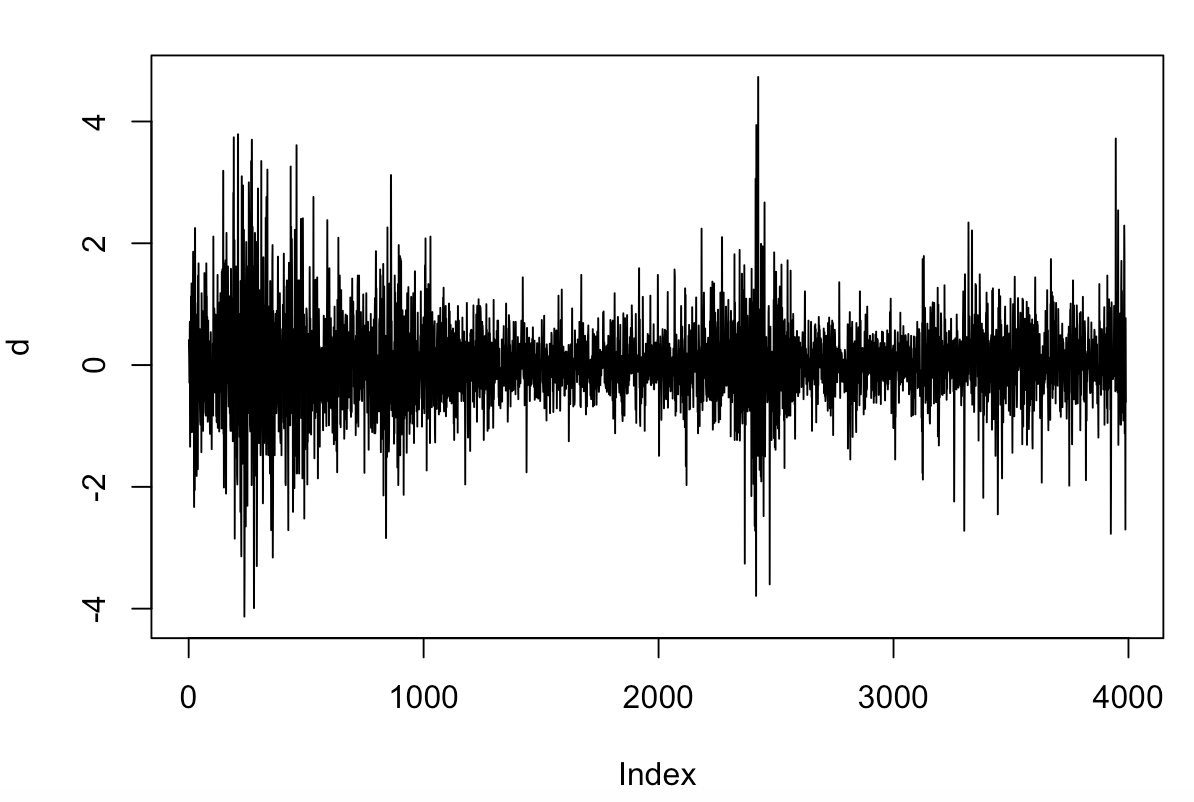
- Compute and plot daily price movements:
> d <- diff(wm$Adj.Close)
> plot(d, type = "l")
The plotted daily price movements appear as follows:
- Generate a histogram of the daily price changes along with a density plot:
> hist(d, ...

