To reduce dimensionality with PCA, follow these steps:
- Read the data:
> bh <- read.csv("BostonHousing.csv")
- View the correlation matrix to check whether some variables are highly correlated and whether PCA has the potential to yield some dimensionality reduction. As we are interested in reducing the dimensionality of the predictor variables, we leave out the outcome variable, MEDV:
> corr <- cor(bh[,-14]) > corrplot(corr, method="color")
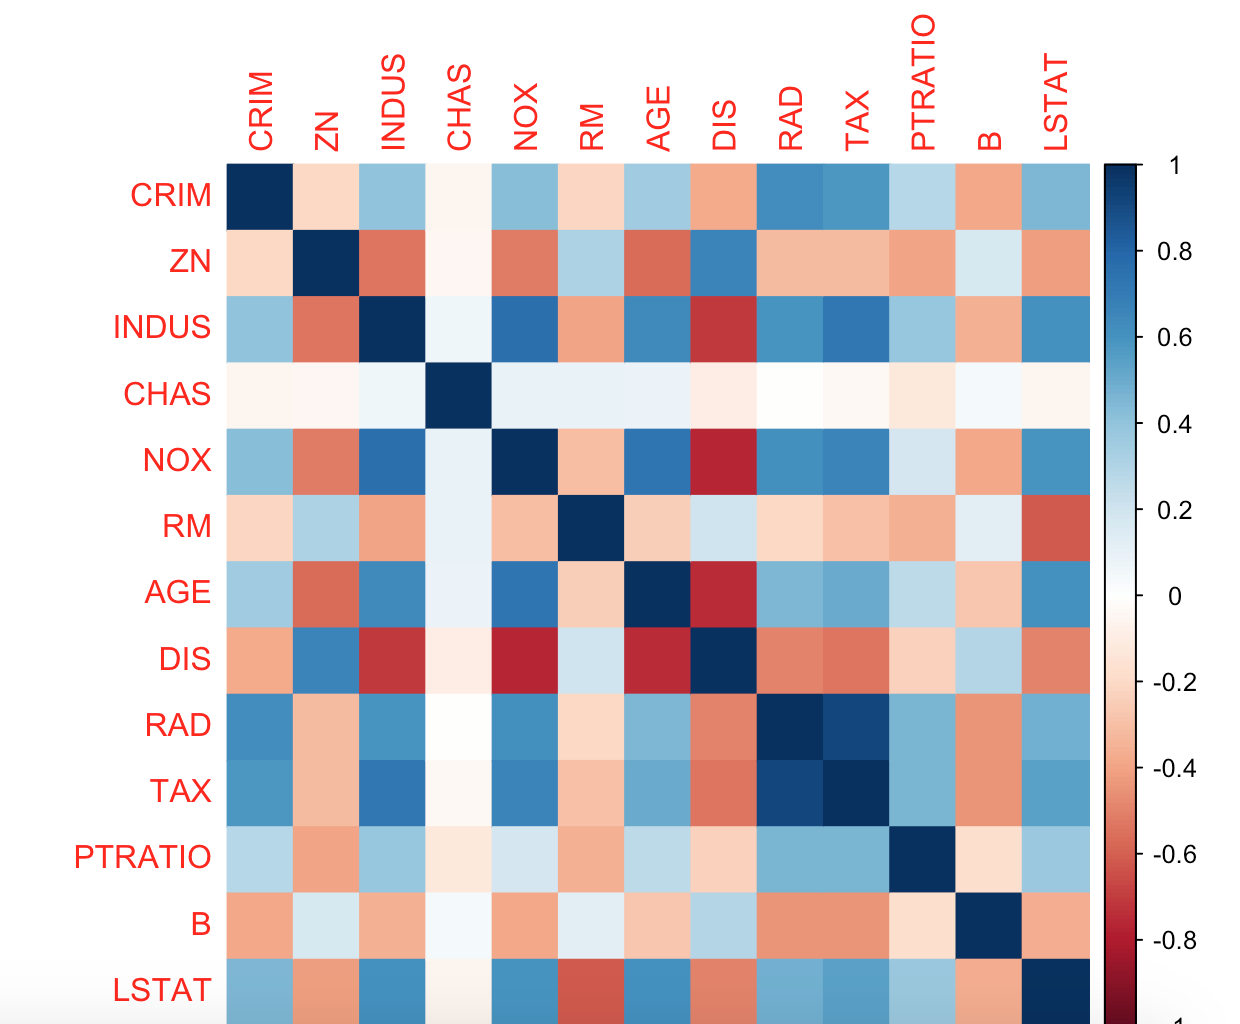
Positive correlations are displayed in blue and negative correlations in red. Color intensity and the size of the circle are proportional to the correlation coefficients. Ignoring the main ...

