September 2017
Beginner to intermediate
560 pages
25h 18m
English
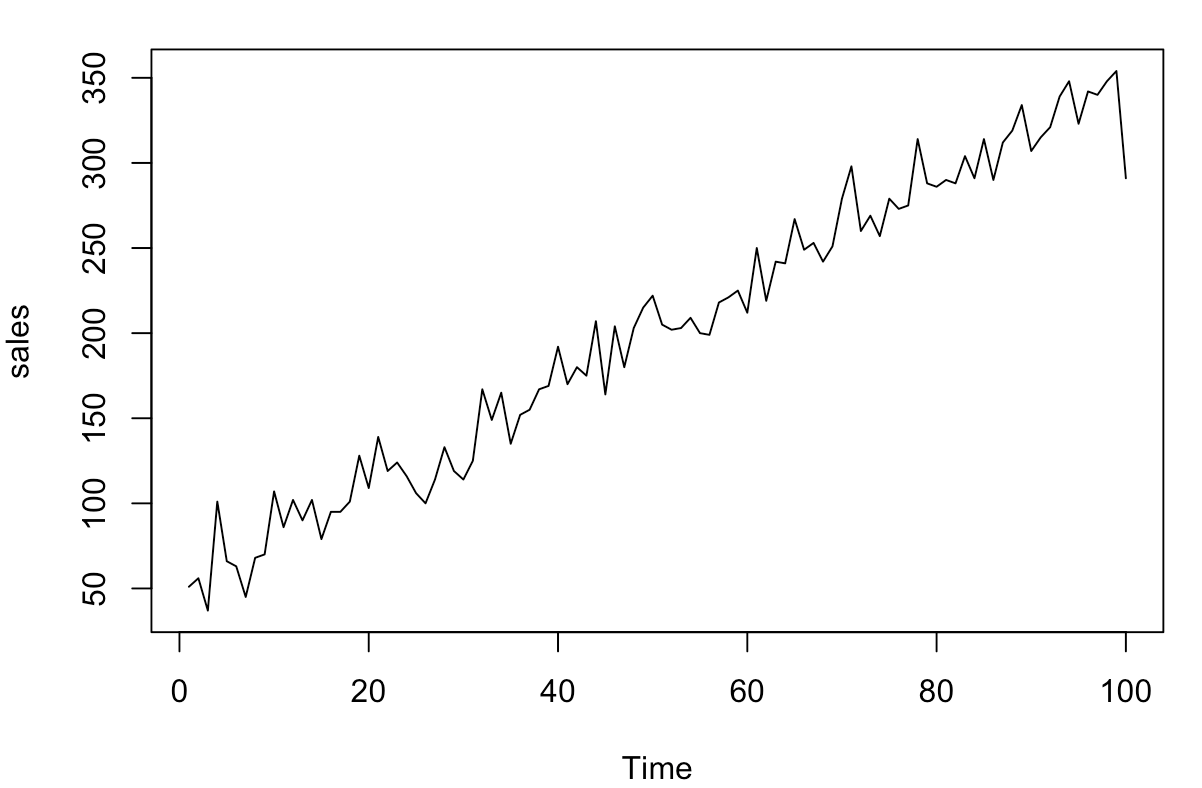
> s <- read.csv("ts-example.csv")
> s.ts <- ts(s)
> class(s.ts)
[1] "ts"
> plot(s.ts)
> s.ts.a <- ts(s, start = 2002)
> s.ts.a
Time Series:
Start = 2002
End = 2101
Frequency = 1
       sales
  [1,]    51
  [2,]    56
  [3,]    37
  [4,]   101
  [5,]    66
  (output truncated)
> plot(s.ts.a)
> # results show that R treated this as an annual
> # time series with 2002 as the starting year
The result of the preceding ...
Read now
Unlock full access


