Chapter 1
An Introduction to R Graphics
Chapter preview
This chapter provides the most basic information to get started producing plots in R. First of all, there is a three-line code example that demonstrates the fundamental steps involved in producing a plot. This is followed by a series of figures to demonstrate the range of images that R can produce. There is also a section on the organization of R graphics giving information on where to look for a particular function.
The following code provides a simple example of how to produce a plot using R (see Figure 1.1).
Figure 1.1
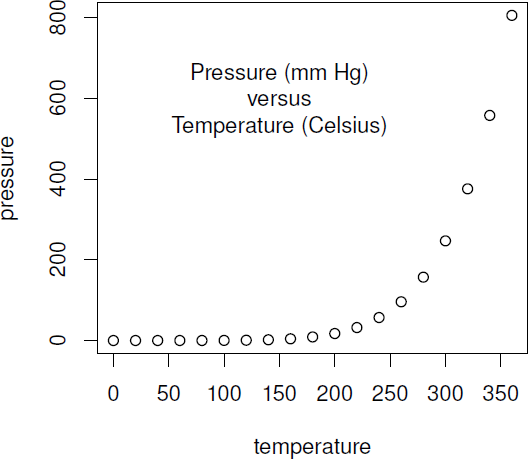
A simple scatterplot of vapor pressure of mercury as a function ...
Get R Graphics, 2nd Edition now with the O’Reilly learning platform.
O’Reilly members experience books, live events, courses curated by job role, and more from O’Reilly and nearly 200 top publishers.

