Chapter 10. Legends
Like the x- or y-axis, a legend is a guide: it shows people how to map visual (aesthetic) properties back to data values.
10.1 Removing the Legend
Problem
You want to remove the legend from a graph.
Solution
Use guides(), and specify the scale that should have its legend
removed (Figure 10-1):
# Create the base plot (with legend)pg_plot<-ggplot(PlantGrowth,aes(x=group,y=weight,fill=group))+geom_boxplot()pg_plot# Remove the legend for fillpg_plot+guides(fill=FALSE)
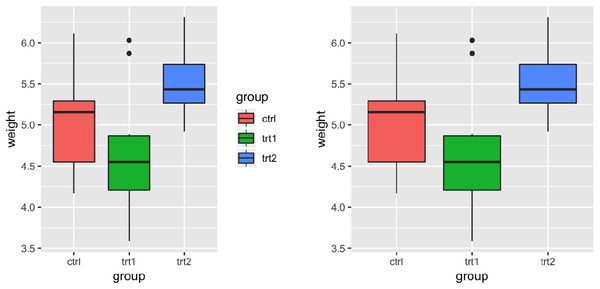
Figure 10-1. Default appearance (left); With legend removed (right)
Discussion
Another way to remove a legend is to set guide = FALSE in the scale.
This will result in the exact same output as the preceding code:
# Remove the legend for fillpg_plot+scale_fill_discrete(guide=FALSE)
Yet another way to remove the legend is to use the theming system. If
you have more than one aesthetic mapping with a legend (color and
shape, for example), this will remove legends for all of them:
pg_plot+theme(legend.position="none")
Sometimes a legend is redundant, or it is supplied in another graph that will be displayed with the current one. In these cases, it can be useful to remove the legend from a graph.
In the example used here, the colors provide the same information that is on the x-axis, so the legend is unnecessary. Notice that with the legend removed, the area used for ...
Get R Graphics Cookbook, 2nd Edition now with the O’Reilly learning platform.
O’Reilly members experience books, live events, courses curated by job role, and more from O’Reilly and nearly 200 top publishers.

