Chapter 6. Maps, Illustrations, and Other Artifacts
I keep promising that Raphael is about more than revisiting memories of high school geometry (something that is always best accomplished with a therapist’s supervision). Right now seems like a fine time to make good on that since we’ve covered all of the core skills for image manipulation.
Let’s dive right in to what is, in my experience, the most common data visualization on the web: a map that can be recolored on demand to represent a geographical dataset. We’ll start with a map of the United States, and then run over how this can be easily extended to any country you’re interested in.
Maps
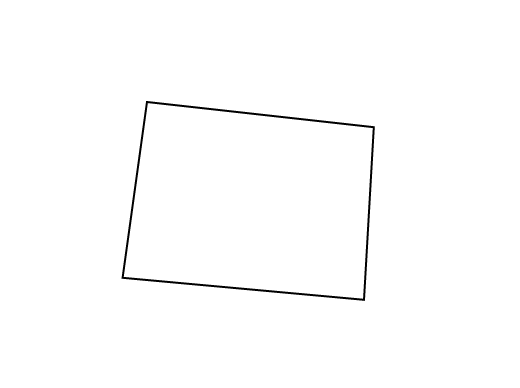
Geographic entities are represented in the browser just like any other shape, as a series of points connected by lines. Colorado, for example—to choose a rather easy one—looks like this:
varCO=paper.path("m 380,320.9l4.9,-86.3l-113.4,-12.6l-12.2,87.9l 120.7,11.0z");

(We think of Colorado as a straight rectangle, but here it comes from a map that mimcs the curvature of the earth, hence the tilt.)
So did I memorize the coordinates for all 50 states and then type them in here by hand? Of course not! Like most good things, this comes from Wikipedia. But we don’t want a map on Wikipedia. We want one on our own website. Let’s talk about how to import that information into Raphael.
Importing SVGs Found in Nature
When it comes to finding structural data ...
Get RaphaelJS now with the O’Reilly learning platform.
O’Reilly members experience books, live events, courses curated by job role, and more from O’Reilly and nearly 200 top publishers.

