Chapter 4. Community RUM: Not Just for Pirates Anymore!
I’m a reflection of the community.
Community measurements? What are these? Simply put, if you can see what other people are experiencing it might help you to avoid some ugly things. In many ways, this is the primary life lesson our parents wanted to instill in us as children. “Learn from others mistakes, because there is not enough time to make all the mistakes yourself.” By being associated with a community (and learning from that community), a person can avoid the most common mistakes.
In that context, let us review what we discussed in the last chapter. It turns out that sites get far less coverage from the vastness of the Internet than typically understood. Of the 51,000 ASNs and ISPs, only a fraction provides RUM measurements on a daily basis to any given website.
More important—and we will discuss this in much greater detail below—the long tail of networks changes all the time and is typically not the same at all for any two given sites.
You could augment your RUM with synthetic measurements. This is certainly possible, but it is also certainly very expensive. To get coverage from even a fraction of the ASNs that don’t produce significant traffic to a site would be a lot of synthetic traffic.
So how can community RUM measurements help?
Crowdsourcing is the act of taking measurements from many sources and aggregating them into a unified view. You can crowd-source anything. In Japan, they have crowd-sourced radiation measurements (post Fukushima). There have been attempts to get surfers to contribute (via crowd sourcing) to sea temperature studies typically performed only by satellites.
As Cullina, Conboy, and Morgan said in their recent work on the subject:
Crowdsourcing as a contemporary means of problem solving is drawing mass attention from the Internet community. In 2014, big brands such as Procter and Gamble, Unilever, and Pepsi Co. increased their investment in crowdsourcing in ranges from 50 percent to 325 percent.
A key element of crowdsourcing is the ability to aggregate. This is in fact what makes it a community.
So, what if you could aggregate the RUM measurements from the five sites we discussed in the last chapter?
The traffic from those sites is quite different, it turns out. The geography is important, so let’s take a quick look at it. The percent listed in the figures that follow is the percent of total measurements taken.
Figure 4-1 shows that the luxury ecommerce website has a very nice spread of traffic from those countries that you would expect are the largest buyers of luxury goods.
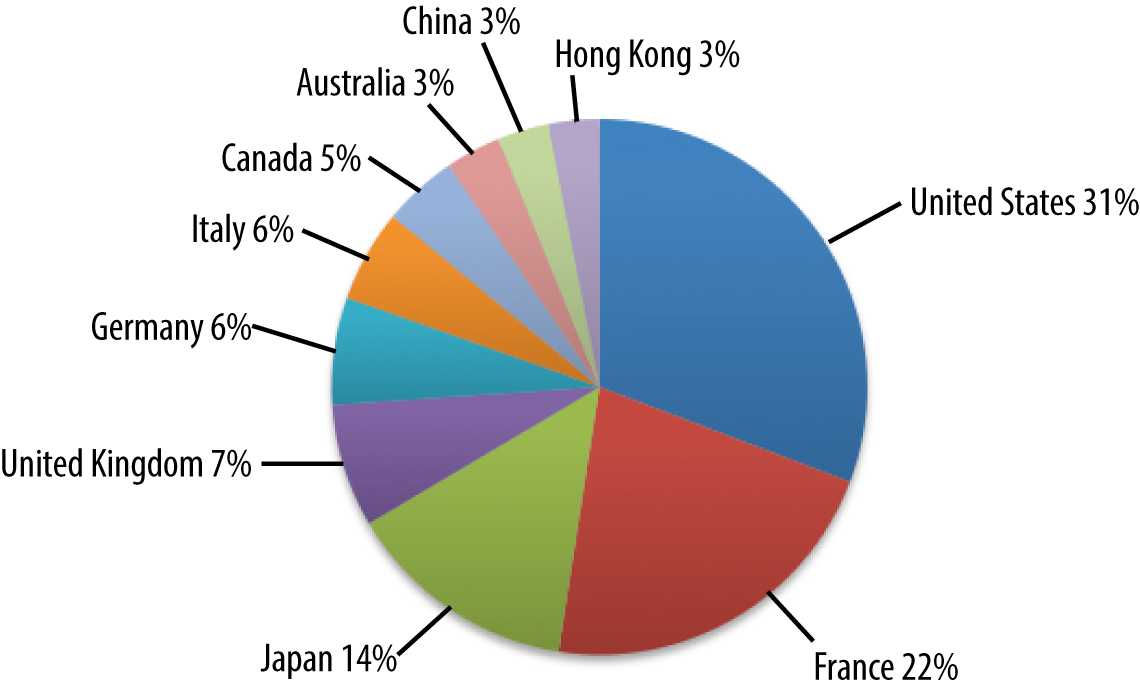
Figure 4-1. Demographics of a luxury ecommerce site
In Figure 4-2, notice that India is much more represented by the social media site. Also note the appearance of Brazil, which was not well represented by the luxury ecommerce site.
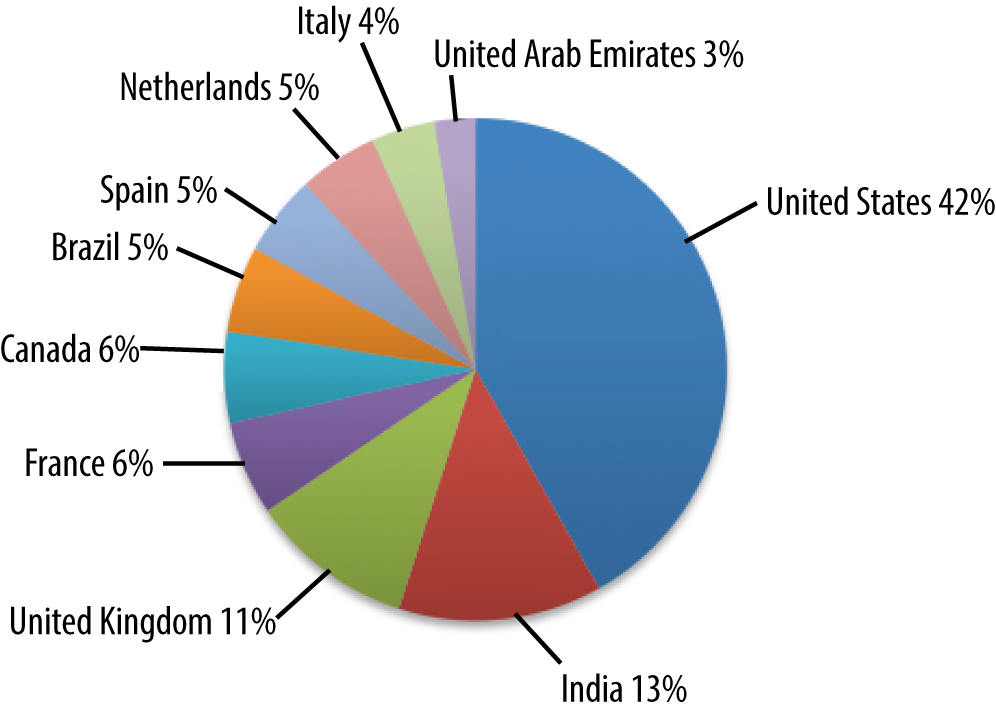
Figure 4-2. Demographics of social media site
Korea has strong representation in Figure 4-3 (unlike the previous sites).
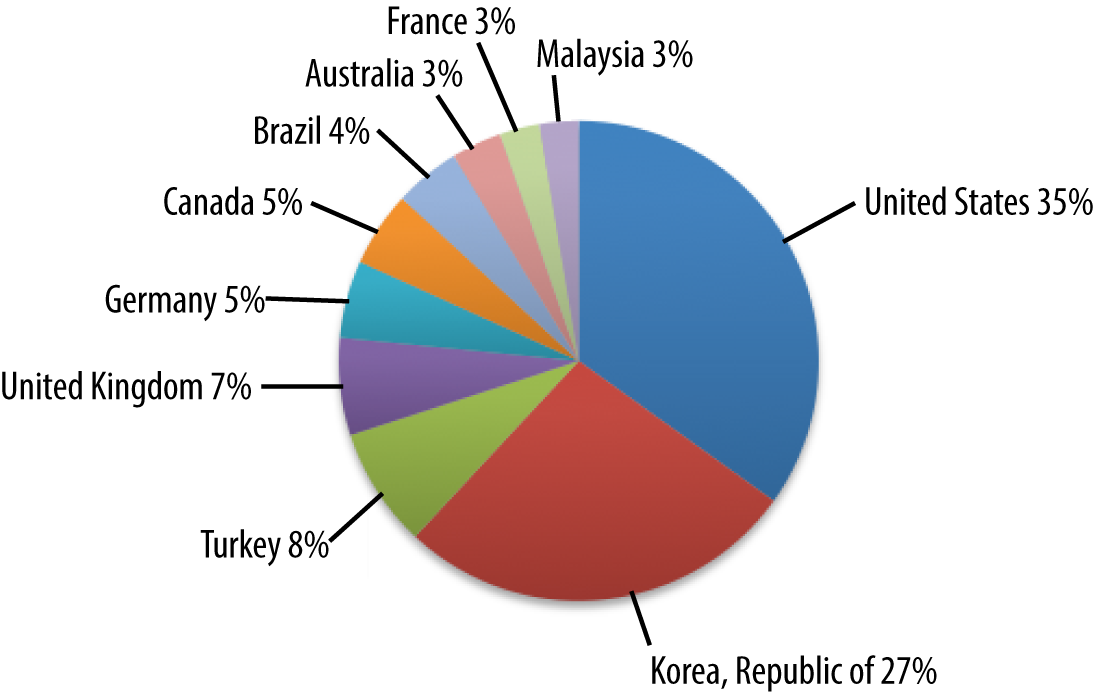
Figure 4-3. Demographics of picture and video-sharing site
The gaming site represented in Figure 4-4 is primarily in the US, but it has some interesting European countries that are not in the previous sites.
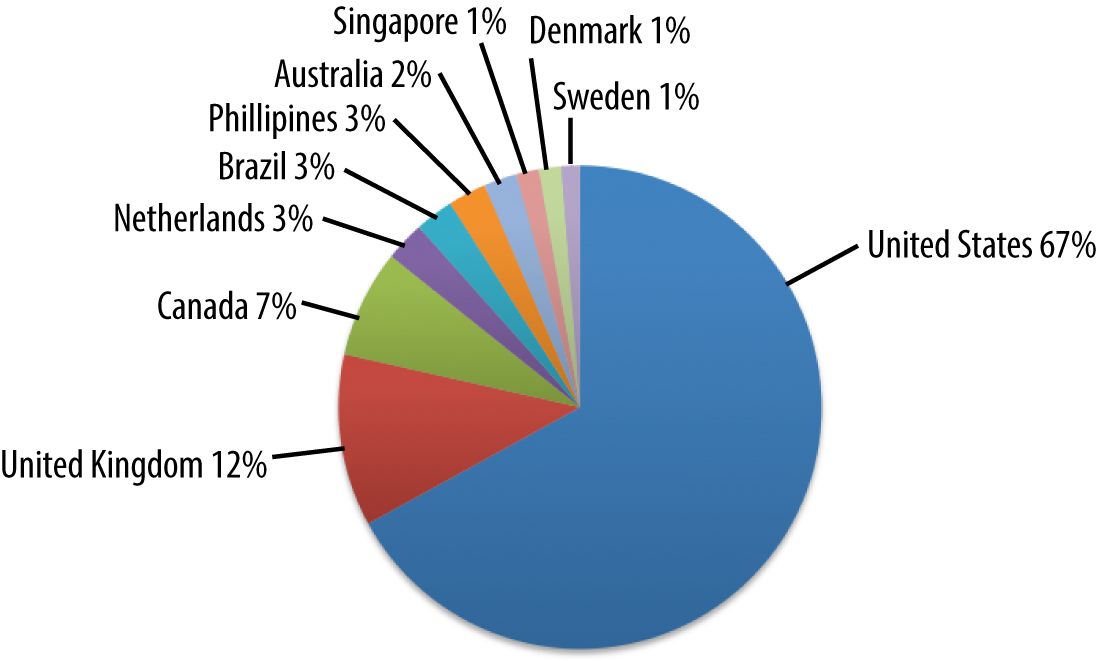
Figure 4-4. Demographics of a gaming site
This Over the Top (OTT) video site depicted in Figure 4-5 clearly has the vast majority of its users in the US. This is probably explained by restrictions on the content that they license. This also explains why they have over 56 percent of total traffic coming from the top 10 ISPs, all US-based.
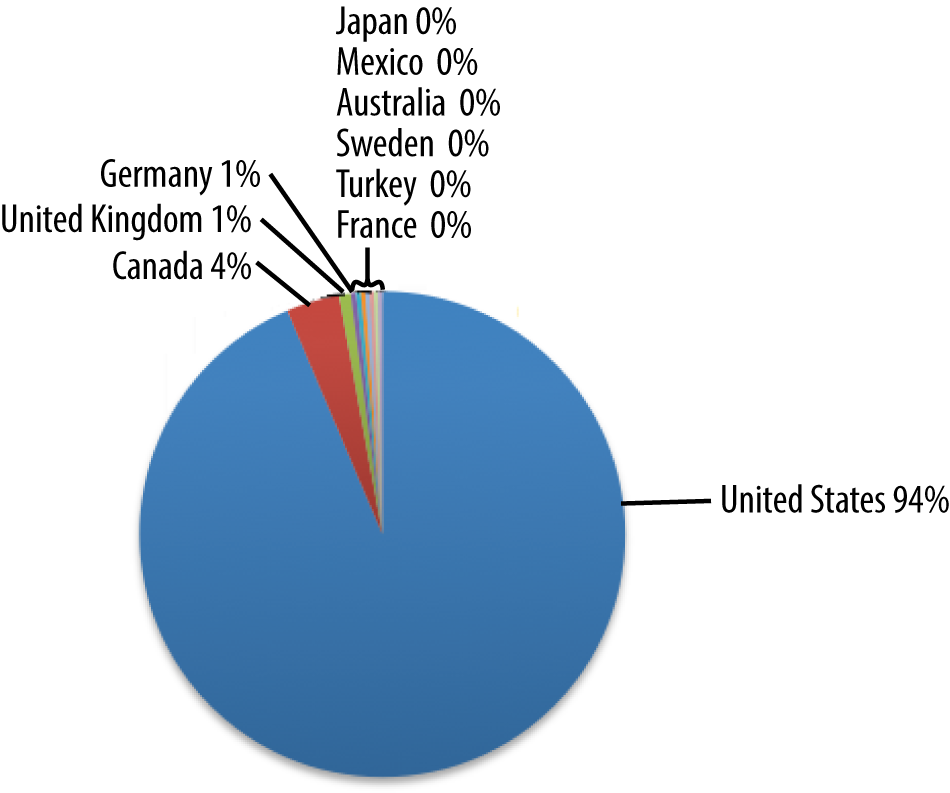
Figure 4-5. Demographics of video OTT site
| Network | Percent of total measurements |
|---|---|
| Comcast Cable Communications, Inc. | 17.4463% |
| AT&T Services, Inc. | 9.5194% |
| MCI Communications Services, Inc. D/B/A Verizon Business | 6.4875% |
| CenturyLink | 5.1738% |
| Charter Communications | 4.3967% |
| Cox Communications | 4.1008% |
| Frontier Communications of America, Inc. | 3.3066% |
| Windstream Communications, Inc. | 2.1121% |
| Time Warner Cable Internet LLC | 1.9290% |
| Time Warner Cable Internet LLC | 1.8162% |
So, how do these five sites stack up with regard to having network overlap? If we take a look at the top ten networks from which each of them receive traffic, we can get a sense of that. Lets color the networks that appear in the top ten networks for all five sites:

Figure 4-6. Top ISPs in common using RUM amongst five sites
So for these five sites (on this day) in the top ten networks from which they received RUM measurements, there were only three networks that they all shared: Verizon, AT&T, and Comcast. As was pointed out earlier, for the OTT site, that was roughly 33 percent of its monitoring traffic from those three networks. From the entire top ten of its networks, the OTT site received a bit more than 50 percent of its traffic overall. This was on the high end. The other sites got anywhere from 25 percent to 48 percent of their traffic from the top ten networks in their portfolio of last-mile networks.
Even when you broaden the filter and allow a network to be colored if it appears in two or more top ten network list, 46 percent of the networks that show up in any of the top ten show up only once (23), whereas 54 percent show up in multiple sites top ten lists.
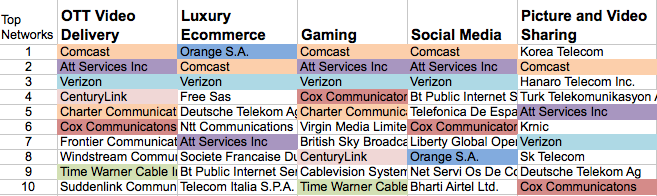
Figure 4-7. Top ISPs in common using RUM amongst five sites with two or more sites in common
Recall that even with 200 million RUM measurements a day, none of these sites saw more than 2,924 of the over 30,000 important networks that make up the Internet, as demonstrated in Figure 4-8.
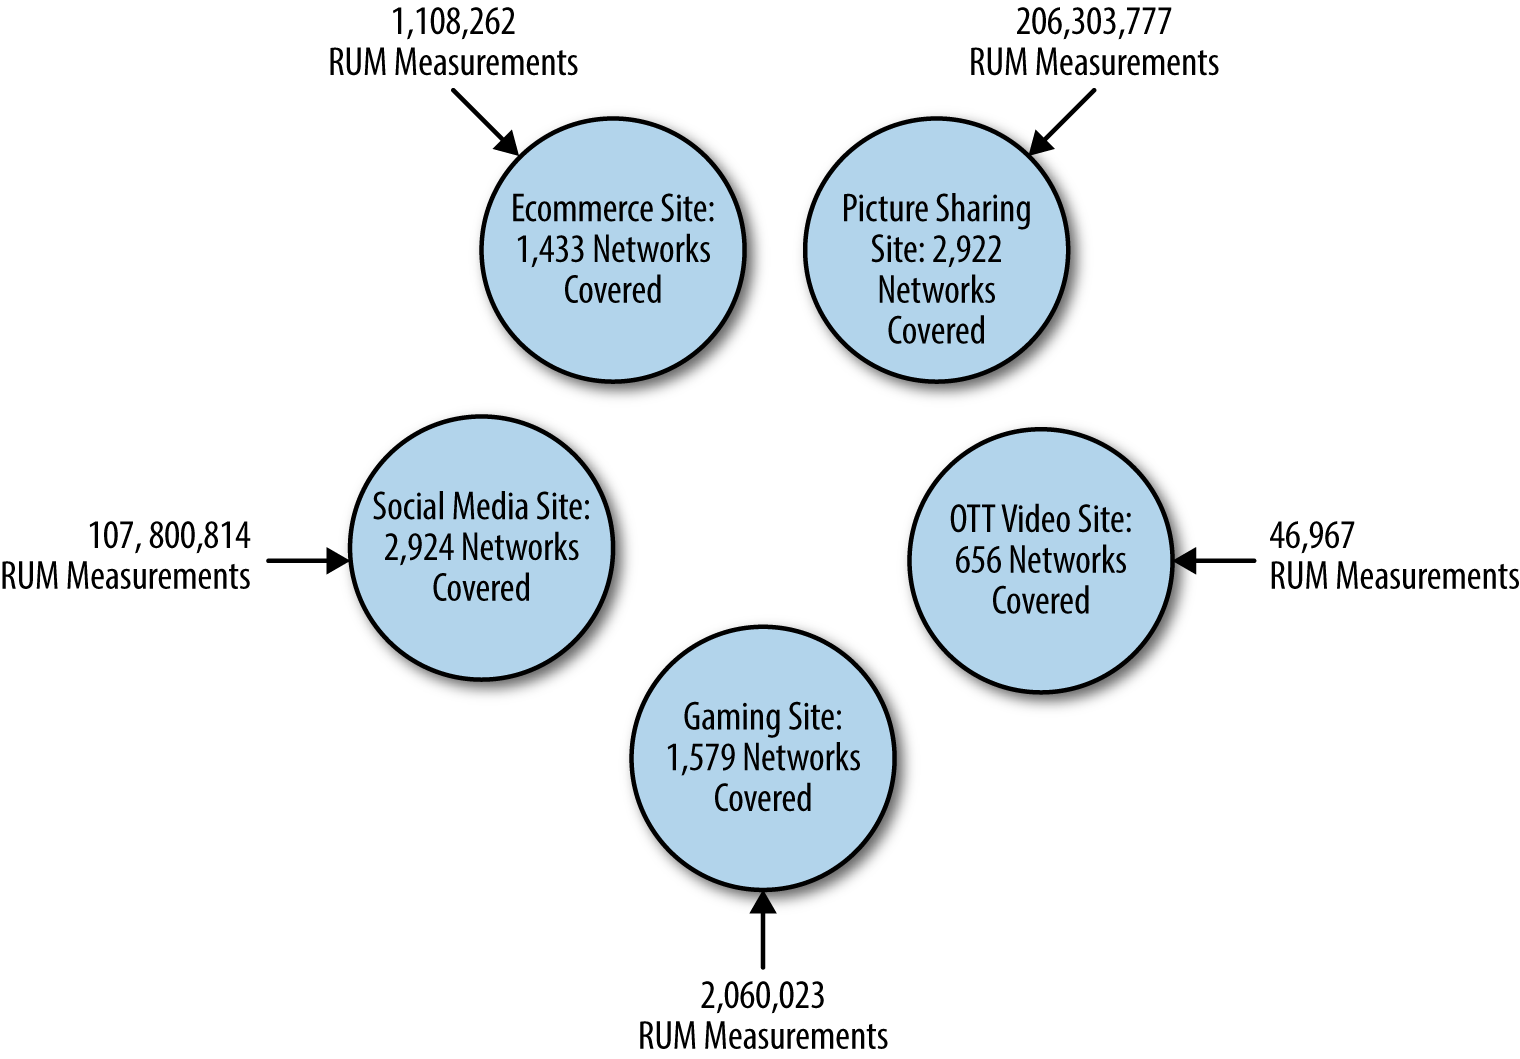
Figure 4-8. RUM coverage of five different sites
Figure 4-9 shows what we get when we combine the measurements and what networks each of the five sites derived its traffic from.
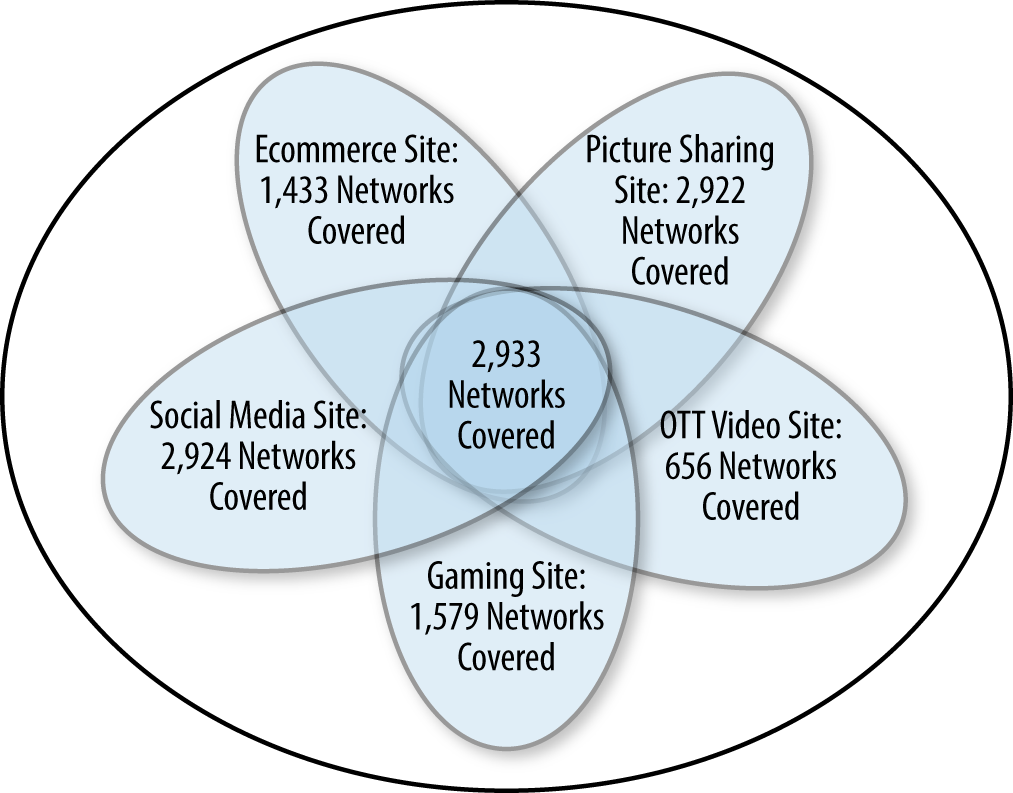
Figure 4-9. Network overlap of the five different sites
So the overlap of last-mile networks appears strong. In fact, what you find is that generally all the networks in the smaller sites set are found in the larger sites set. But it is not a perfect containment relationship. Table 4-2 provides some examples.
The lefthand column is the name of the last-mile network, and the remaining five columns are the five sites we have been discussing, along with the number of measurements that originated from that network. As you can see in the sample set, there were many examples in the data where smaller sites had some measurements from a last-mile network when the larger ones did not. This is not the complete list either; it was just a sample of them that I pulled out of the data. There are literally hundreds of examples where larger sites had fewer measurements on a particular network than smaller sites. As you can also see in the sample set, the gaming site (in spite of generating more than two million measurements from all over the world) had no measurements from these selected networks.
| Last mile network | OTT site (46,967) | Luxury ecommerce (1,108,262) | Gaming (2,060,023) | Social media (107,800,814) | Picture and video sharing (260,303,777) |
|---|---|---|---|---|---|
| 2Talk Global IP network | 10 | 0 | 0 | 3,293 | 2,029 |
| Academic Seneca network | 1 | 0 | 0 | 889 | 3,818 |
| Afghantelecom Government Communication network | 1 | 0 | 0 | 6,098 | 1,993 |
| Airtel Tanzania | 2 | 0 | 0 | 3,586 | 2,803 |
| Arab American University Jenin | 0 | 0 | 0 | 44 | 0 |
| Bangladesh Telecommunications Company | 44 | 0 | 0 | 5,144 | 1,290 |
| Blackberry Limited | 0 | 15 | 0 | 0 | 0 |
| Hec Pern | 1 | 0 | 0 | 18,242 | 11,556 |
| Hong Kong University of Science and Technology | 14 | 0 | 0 | 3,502 | 7,547 |
| Jawwal | 0 | 0 | 0 | 492 | 0 |
| Meghbela Broadband | 2 | 0 | 0 | 5,471 | 2,778 |
| Rasaneh Avabarid Private Joint Stock Company | 0 | 25 | 0 | 2,125 | 0 |
| Safaricom Limited | 6 | 0 | 0 | 13,902 | 10,000 |
| Saudi Basic Industries Company | 0 | 0 | 0 | 8,625 | 0 |
| Seokyung Cable Television Co., Ltd. | 2 | 0 | 0 | 26 | 169,590 |
| Shahrad Net Company Ltd. | 0 | 0 | 0 | 2,670 | 0 |
| Sonic Wireless | 5 | 0 | 0 | 1,265 | 1,218 |
| Telefonica De Costa Rica TC, S.A | 2 | 0 | 0 | 1,553 | 2,564 |
We can attribute some of this to the varying demographics of the five sites’ visitors that we discussed earlier. The last halves of visitors of each of the sites’ networks are not only different among each other on a daily basis, they’re even different day over day within each of the sites. So there is a “network effect” (no pun intended) that magnifies the number of networks that participate in the community.
Something really important to remember here is that our top-down analysis showed there were roughly 30,000 last-mile networks with traffic that matters. With these five sites (on this day), we saw 2,933 last-mile networks. That’s less than ten percent of the ones that matter. How many sites would need to contribute to the community to get a significant percentage of 30,000 last-mile networks around the world?
Assume that every site you add is “additive” to the network by 0.5 percent, meaning that it brings with it some small number of networks that have not been in the mix with the community. Of course, very large sites would have a bigger additive effect and smaller sites would have less of an impact. But, as you saw earlier there are four examples for which only one site saw traffic from a particular network. In our entire dataset of 2,933 networks, there were 15 examples of when only one of the five sites saw a network. This represents 0.51 percent additive, meaning how many times a site sees a network that other sites do not see. Using this number, we can extrapolate out how many sites would need to be in the community, as shown in Figure 4-10.
As has been noted, the five websites I selected for our analysis garner 2,933 networks being measured. Extrapolating out, we see 300 websites would get us 9,532 networks being monitored. It takes more than 800 web properties in such a community before you get close to the goal of 30,000 networks. This calculation does not take into consideration a number of factors that are important, such as demographics, size of site, and other important components. Even with all the warts this method of calculation has, it is interesting to note that it would take 800 web properties implementing a RUM tag in this hypothetical RUM community before you would have more than 28,000 of the networks covered. What this calculation also ignores is the number of measurements from each network. As I discussed earlier, getting one measurement per day is not adequate for most of the tasks that this RUM data would be used for; having at least hourly data would be far more desirable. If we recalculated this to include hourly data as a requirement, the number of “acceptable networks” would be far lower and thereby the number of web properties that would need to deploy a RUM tag would be far higher.
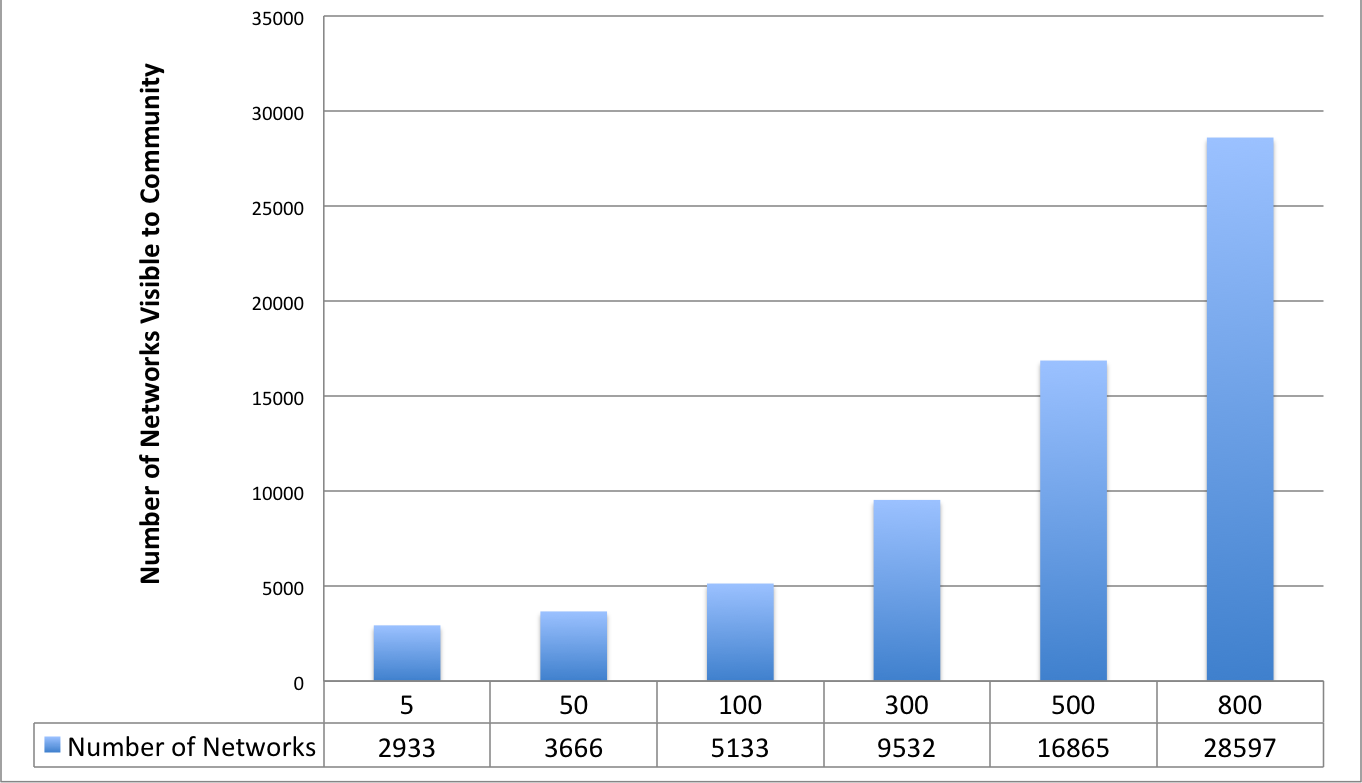
Figure 4-10. The number of sites needed in a community to garner adequate coverage
The idea of gathering data and aggregating it into a view that makes transparent patterns is not new. This is basic data science. Data about performance on the Internet is also not new: M-Lab has been doing this very successfully for a while synthetically. Historically getting RUM data from the various companies that run their own websites has not been trivial. For a variety of reasons, many companies can be hesitant to share their RUM data. Recently, there are a number of companies that have started to build these types of anonymous communities of RUM data so that their user bases can benefit. Some of these companies report trends, whereas others make the data actionable in real time. The common thread is the ability to aggregate this data and report and use it to overcome the vastness of the Internet.
Get Real User Measurements now with the O’Reilly learning platform.
O’Reilly members experience books, live events, courses curated by job role, and more from O’Reilly and nearly 200 top publishers.

