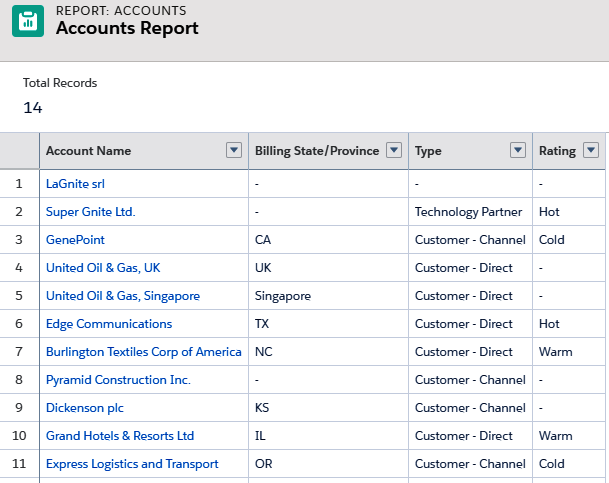
The second option we have when creating a new report is selecting the report format. Here, we can choose between the following types:
- Tabular: This is a simple list of records with fields displayed in columns, similar to a spreadsheet. This format cannot be used to group data or used with charts or within dashboards (unless you limit the number of rows):

- Summary: Similar to tabular reports, we can group rows of data (with subtotals) based on a given field and create charts on those groupings (for example, group cases on the Status field and read the subtotals for each status):

