Example 6.8. Presenting Graphics and Tables in the Same Report
Goal
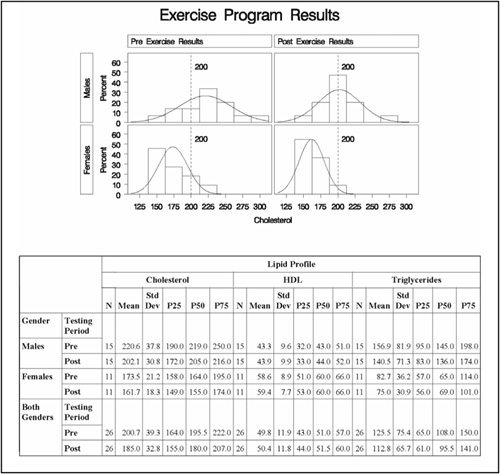
Describe data visually in graphs and numerically in tables in the same report. Add graphs to the report in Example 3.3. Send the output to a nonlisting destination.
Report
Example Features
| Data Set | LIPIDS |
| Report Example | Example 3.3 |
| Featured Steps and Statement | PROC UNIVARIATE
PROC TABULATE ODS statement |
| Featured Step Statements and Options | ODS statement: STARTPAGE= option
PROC UNIVARIATE
|
Get SAS® Guide to Report Writing: Examples, Second Edition now with the O’Reilly learning platform.
O’Reilly members experience books, live events, courses curated by job role, and more from O’Reilly and nearly 200 top publishers.

