EXAMPLE 23 Plotting Coordinates on a Map
Purpose: Show how to plot latitude and longitude path data on a map.
As with many of my examples, this one is my imitation of an example I found on the Web. The map below originally caught my attention on Wikipedia1. I thought the map did a very good job of showing where tropical storms generally occur and what path they take. The map also graphically shows why the storms are called âtropical.â
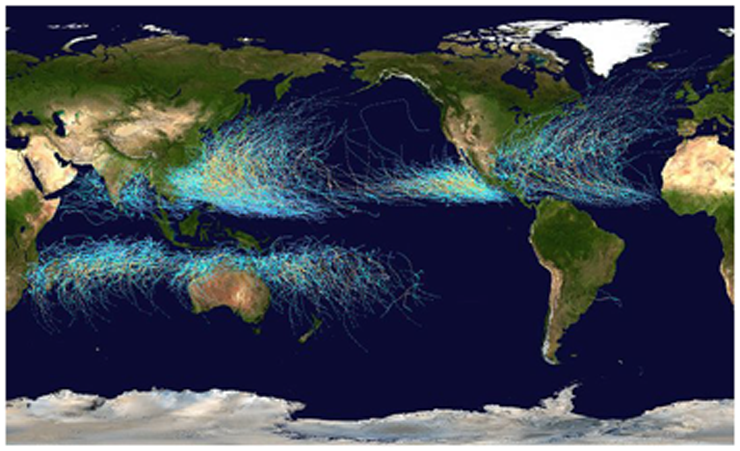
That original map is centered on the Pacific Ocean, which is a good way to map tropical storm data. However, SAS does not ship a world map arranged in that configuration. The SAS world map is centered on ...

