You can view the iris dataset with Pandas, a library built on top of NumPy:
- Create a dataframe with the observation variables iris.data, and column names columns, as arguments:
import pandas as pdiris_df = pd.DataFrame(iris.data, columns = iris.feature_names)
The dataframe is more user-friendly than the NumPy array.
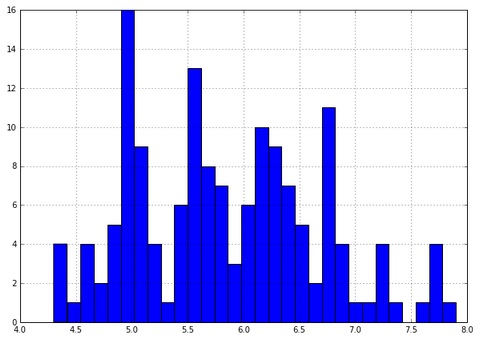
- Look at a quick histogram of the values in the dataframe for sepal length:
iris_df['sepal length (cm)'].hist(bins=30)
- You can also color the histogram by the target variable:
for class_number in np.unique(iris.target): plt.figure(1) iris_df['sepal length (cm)'].iloc[np.where(iris.target == class_number)[0]].hist(bins=30) ...

