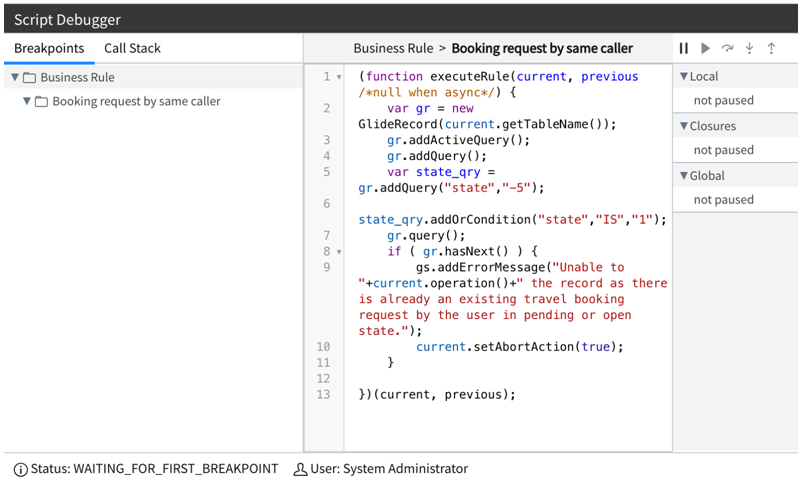
To properly use Script Debugger, it is important to understand its interface. Clicking on the Open Script Debugger icon in any Script field opens up the debugger in a new window. The debugger will open in active (running) state, as shown here:

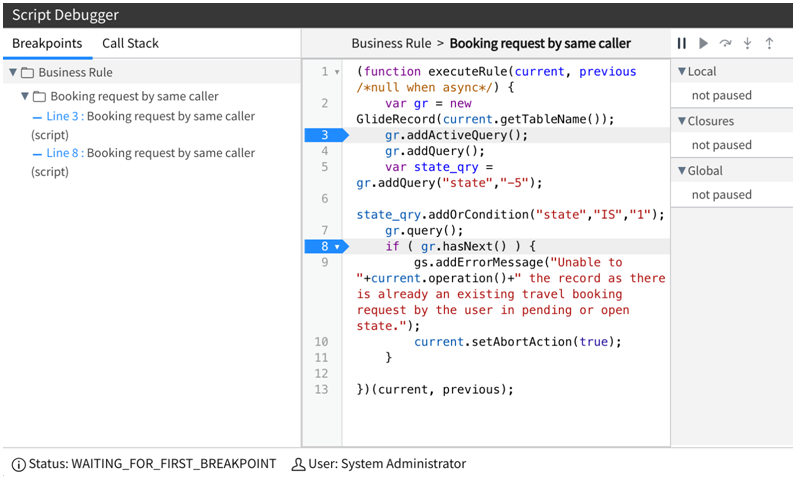
We can set breakpoints by simply clicking on the line numbers. The line number will be highlighted with bookmark-shaped break icons as shown in the following screenshot:

The status bar of Script Debugger window can provide useful information, such as whether the debugger is running ...

