- Open any standard web browser and type the instance address.
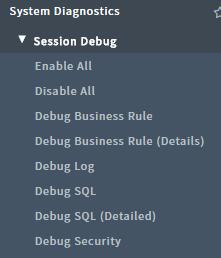
- On the left-hand side, type Debug in the search box and Service-Now will search the System Diagnostics application for you, as shown here:

System diagnostics module
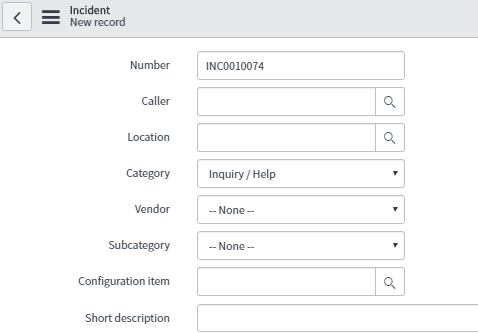
- To understand the debug better, you can open an incident from, as given here, by going to the Incident application:

New incident for troubleshooting
- Now go to Session Debug under System Diagnostics application and click on Enable All, as shown here:
Debugging
- You will now be able to see text, as ...

