Formatting the Resource Usage View
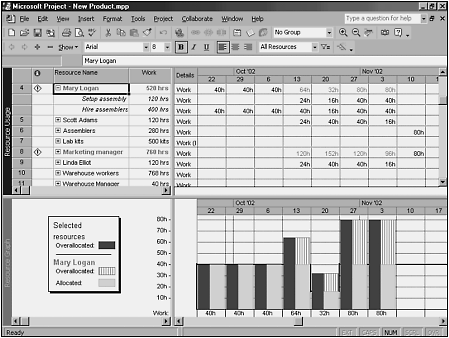
The Resource Usage view shows the same data that is displayed in the Resource Graph view, except that the values appear as number entries in a grid under the timescale. Figure 20.38 shows the Resource Usage view above the Resource Graph view, to demonstrate the similarity of the data presented in these two views. In both views, the value displayed is scheduled Work.
Figure 20.38. You can show values and their graphic representations by combining the Resource Usage view and the Resource Graph view.

The Format menu options for the Resource Usage view include text styles and formatting for fonts, gridlines, and ...
Get Special Edition Using Microsoft® Project 2002 now with the O’Reilly learning platform.
O’Reilly members experience books, live events, courses curated by job role, and more from O’Reilly and nearly 200 top publishers.

