CHAPTER 14Technical analysis
Technical analysis is the study of the past price movements of an individual share, a market sector or the market as a whole to gain an insight into where the price might go.
Charts convert a table of data into an easy-to-interpret graph. Take the example of figure 14.1 (overleaf): is it easier to tell the share’s recent price history by looking at the table or the graph? The graph provides a quick snapshot of how the company’s share price has travelled.
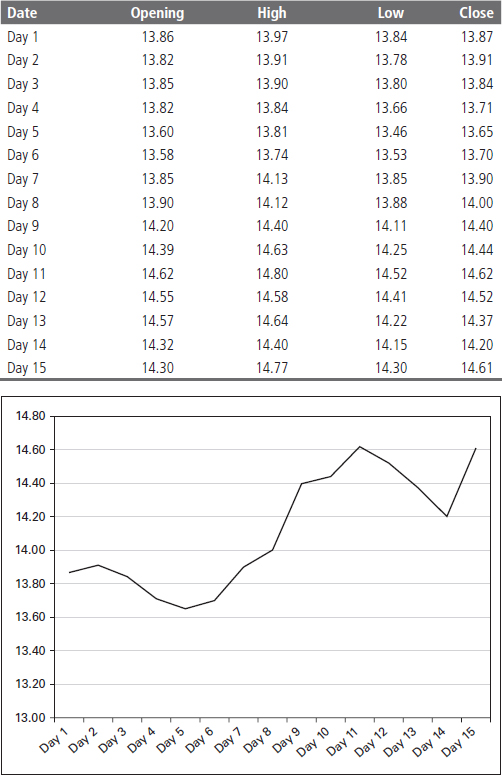
Figure 14.1: table of data versus line graph
To understand where technical analysis fits in, let’s examine the objectives of both fundamental and technical ...
Get Starting Out in Shares the ASX Way, 3rd Edition now with the O’Reilly learning platform.
O’Reilly members experience books, live events, courses curated by job role, and more from O’Reilly and nearly 200 top publishers.

