Chapter 7
Summarizing It All
IN THIS CHAPTER
Working with things great and small
Understanding symmetry, peaks, and plateaus
Getting descriptive
Serving up statistics on a tray
Measures of central tendency and variability are excellent ways of summarizing a set of scores. They aren’t the only ways, though. Central tendency and variability make up a subset of descriptive statistics. Some descriptive statistics are intuitive — like count, maximum, and minimum. Some are not — like skewness and kurtosis.
In this chapter, I discuss descriptive statistics, and I show you Excel’s capabilities for calculating them and visualizing them.
Counting Out
The most fundamental descriptive statistic I can imagine is the number of scores in a set of scores. Excel offers five ways to determine that number. Yes, five ways. Count them.
COUNT, COUNTA, COUNTBLANK, COUNTIF, COUNTIFS
Given an array of cells, COUNT gives you the amount of those cells that contain numerical data. Figure 7-1 shows that I’ve entered a group of scores, selected a cell to hold COUNT’s result, and opened the Function Arguments dialog box for COUNT.
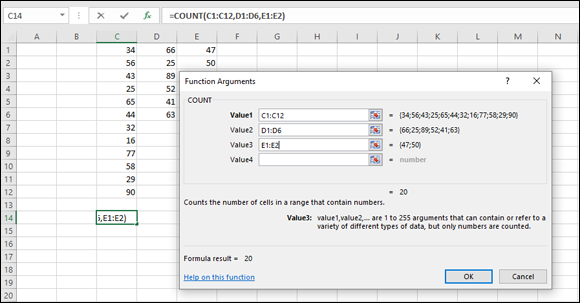
FIGURE 7-1: The Function Arguments dialog box for COUNT, showing multiple arguments.
Here are the steps:
-
Enter your data into the worksheet and select a cell for the result.
I entered data into columns C, D, and E to show off COUNT’s multi-argument capability. I selected ...
Get Statistical Analysis with Excel For Dummies, 4th Edition now with the O’Reilly learning platform.
O’Reilly members experience books, live events, courses curated by job role, and more from O’Reilly and nearly 200 top publishers.

