Chapter 16
It’s About Time
IN THIS CHAPTER
Understanding time series
Moving averages
Smoothing things out
Forecasting with just one (?) click
In many fields (science, medicine, business), it’s often necessary to take measurements over successive intervals of time. When you have this kind of data, you have yourself a time series. This chapter tells you about time series and how to use Excel to understand them and use them to make forecasts.
A Series and Its Components
Managers often have to base their decisions on time series — like sales figures — and the numbers in a time series typically show numerous ups and downs.
Here’s an example. The (totally fictional) FarDrate Timepiece Corporation markets the beautifully designed MeesKyte watch, and they gather the quarterly national sales figures. Figure 16-1 shows a spreadsheet and a graph of these sales figures from 2011–2015.
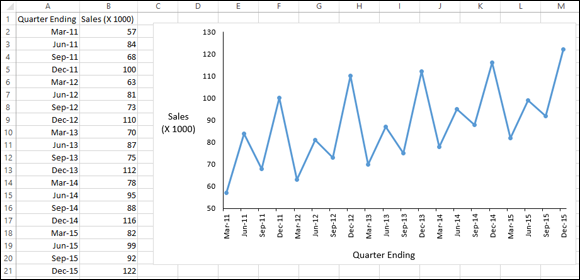
FIGURE 16-1: Quarterly sales figures for the FarDrate MeesKyte watch.
Take a look at the graph. The peaks and valleys seem pretty regular. Sales peak in the last quarter of every year — perhaps people buy these watches as holiday gifts. Sales also peak somewhat (but not as much) in the middle of each year — maybe parents are buying MeesKyte watches as graduation presents. This pattern repeats from year to year, and it’s called the seasonal component of the time series.
We also see sales moving generally ...
Get Statistical Analysis with Excel For Dummies, 4th Edition now with the O’Reilly learning platform.
O’Reilly members experience books, live events, courses curated by job role, and more from O’Reilly and nearly 200 top publishers.

