5
Histograms for fuzzy data
Classical histograms are based on precise data x1,…,xn in order to explain the distribution of the observations xi. In order to construct histograms the set M of possible values xi is decomposed into so-called classes K1,…,Kk with Ki ∩ Kj = ![]() ∀i ≠ j, and
∀i ≠ j, and
![]()
Then for each class Kj the so-called relative frequency hn(Kj) is calculated, i.e.
![]()
The display of the relative frequencies is called a histogram.
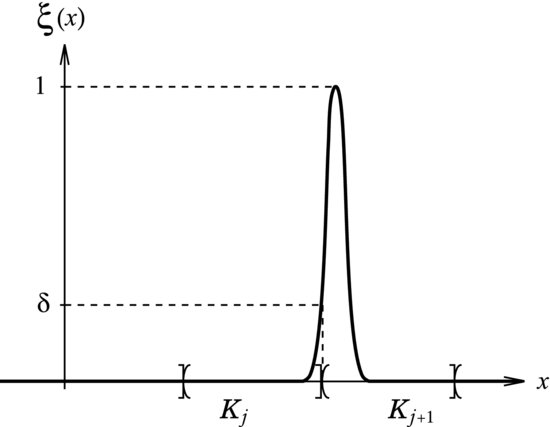
For fuzzy data the following problem arises: By the fuzziness of observations it is not always possible to decide in which class Kj a fuzzy observation x* with characterizing function ξ(·) lies. This is depicted in Figure 5.1.
Figure 5.1 Fuzzy observation and classes of a histogram.
Therefore a generalization of histograms is necessary.
5.1 Fuzzy frequency of a fixed class
Due to the possible inability to decide in which class a fuzzy data point xi* lies it seems natural to consider fuzzy values of relative frequencies. For n fuzzy observations x1*,…,xn* and classes K1,…,Kk the fuzzy relative frequencies of the classes are denoted by hn*(Kj), j = 1(1)k. The characterizing ...

