Chapter 4
Application to a chemical reaction process
This chapter summarizes an application of MSPC, described in Chapters 1 to 3, to recorded data from a chemical reaction process, producing solvent chemicals. Data from this process have been studied in the literature using PCA and PLS, for example (Chen and Kruger 2006; Kruger et al. 2001; Kruger and Dimitriadis 2008; Lieftucht et al. 2006a). Sections 4.1 and 4.2 provide a process description and show how to determine a PCA monitoring model, respectively. Finally, Section 4.3 demonstrates how to detect and diagnose a fluidization problem in one of the tubes.
4.1 Process description
This process produces two solvent chemicals, denoted as F and G, and consists of several unit operations. The core elements of this plant are five parallel fluidized bed reactors, each producing F and G by complex exothermic reactions. These reactors are fed with five different reactants. Figure 4.1 shows one of the parallel reactors.
Figure 4.1 Schematic diagram of chemical reaction process.
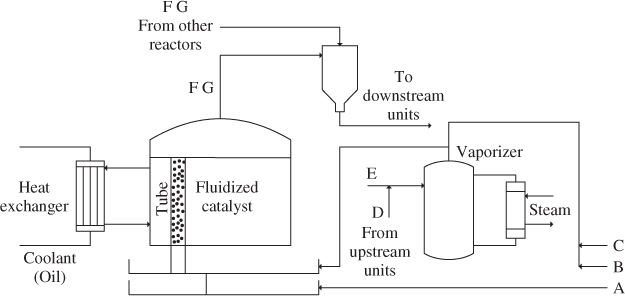
Streams A, B and C represent fresh reactant feed supplying pure components A, B and C, while feedstream D is from an upstream unit. Stream E is plant recycle. Streams D and E are vaporized before entering the reactor. After leaving the reactors, the separation of components F and G is achieved by downstream distillation units.
Each reactor consists of a large ...
Get Statistical Monitoring of Complex Multivariate Processes: With Applications in Industrial Process Control now with the O’Reilly learning platform.
O’Reilly members experience books, live events, courses curated by job role, and more from O’Reilly and nearly 200 top publishers.

