4Variance
A measure of variability is perhaps the most important quantity in statistical analysis. The greater the variability in the data, the greater will be our uncertainty in the values of parameters estimated from the data, and the lower will be our ability to distinguish between competing hypotheses about the data.
Consider the following data, y, which are plotted simply in the order in which they were measured:
y <- c(13,7,5,12,9,15,6,11,9,7,12)plot(y,ylim=c(0,20))
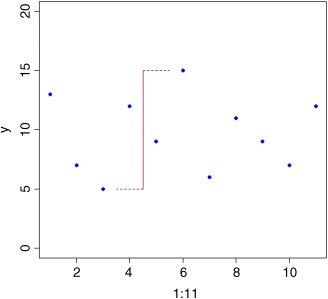
How can we quantify the variation (the scatter) in y that we can see here? Perhaps the simplest measure is the range of y values:
range(y)
[1] 5 15
plot(1:11,y,ylim=c(0,20),pch=16,col="blue")lines(c(4.5,4.5),c(5,15),col="brown")lines(c(4.5,3.5),c(5,5),col="brown",lty=2)lines(c(4.5,5.5),c(15,15),col="brown",lty=2)

This is a reasonable measure of variability, but it is too dependent on outlying values for most purposes. Also, we want all of our data to contribute to the measure of variability, not just the maximum and minimum values.
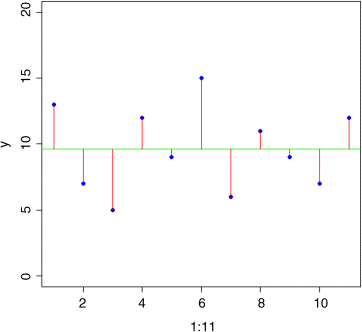
How about estimating the mean value, and looking at the departures from the mean (known as ‘residuals’ or ‘deviations’)?
plot(1:11,y,ylim=c(0,20),pch=16,col="blue")abline(h=mean(y),col="green")for (i in 1:11) lines(c(i,i),c(mean(y),y[i]),col="red")

The longer the ...
Get Statistics: An Introduction Using R, 2nd Edition now with the O’Reilly learning platform.
O’Reilly members experience books, live events, courses curated by job role, and more from O’Reilly and nearly 200 top publishers.

