... answer is at the mean. Think of two children on a seesaw. If one child is heavier than the other, then the heavier child has to sit near the fulcrum unless he wants to sit there with his friend lifted in the air. Values in the histogram that lie far from the center are like children sitting far from the fulcrum; they exert more leverage. The data cannot move, so the fulcrum—the mean—slides over to make the histogram balance.
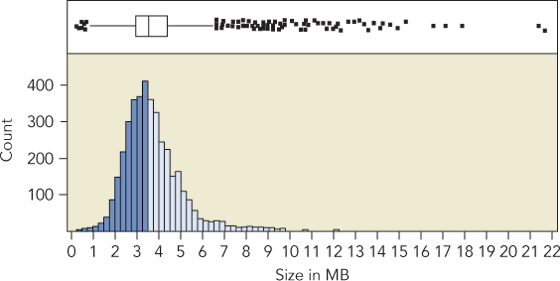
Figure 4.5 The median splits the area of the histogram in half.
Now that we have seen the connection of the mean and median to the histogram, it is easier to appreciate the difference between these two summary statistics. Both ...
Get Statistics for Business: Decision Making and Analysis, 3rd Edition now with the O’Reilly learning platform.
O’Reilly members experience books, live events, courses curated by job role, and more from O’Reilly and nearly 200 top publishers.

