... indicating a nearly symmetric distribution. If we mix diamonds of varying quality, the skewness grows to K3 ≈ 1.1. If K3 > 1, there’s quite a bit of skewness and the data are not normally distributed.
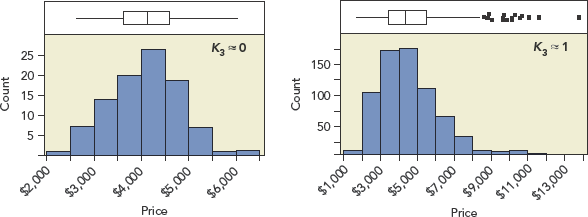
Figure 12.21 The distribution of diamonds of varying quality is skewed to the right.
Kurtosis also captures a deviation from normality. Kurtosis measures the prevalence of outliers. The kurtosis is the average z-score raised to the fourth power, minus 3.
Subtracting 3 makes K4 ≈ 0 for normally distributed data. (This definition is ...
Get Statistics for Business: Decision Making and Analysis, 3rd Edition now with the O’Reilly learning platform.
O’Reilly members experience books, live events, courses curated by job role, and more from O’Reilly and nearly 200 top publishers.

