... all from this one population. (We took 10,000 samples.) For each sample of 100 transactions, we calculated its average and added that value to the histogram.
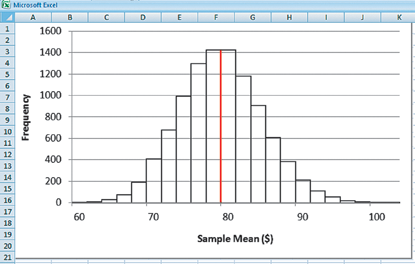
Figure 13.1 Each sample has its own mean, as shown in this histogram of sample averages.
The averages of these samples cluster around the population mean μ = $78 (the red line in the histogram), but some averages are considerably different from μ. At the far left, the average purchase in one random sample is about $60, whereas averages in other samples reach toward $100 at the far right. A manager who fails to appreciate the differences among samples might not appreciate the size of credit ...
Get Statistics for Business: Decision Making and Analysis, 3rd Edition now with the O’Reilly learning platform.
O’Reilly members experience books, live events, courses curated by job role, and more from O’Reilly and nearly 200 top publishers.

