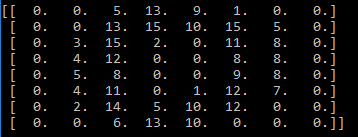
The PCA example has been illustrated with the handwritten digits example from scikit-learn datasets, in which handwritten digits are created from 0-9 and its respective 64 features (8 x 8 matrix) of pixel intensities. Here, the idea is to represent the original features of 64 dimensions into as few as possible:
# PCA - Principal Component Analysis
>>> import matplotlib.pyplot as plt
>>> from sklearn.decomposition import PCA
>>> from sklearn.datasets import load_digits

>>> digits = load_digits()
>>> X = digits.data
>>> y = digits.target


>>> print (digits.data[0].reshape(8,8))

Plot the graph ...

