Summary
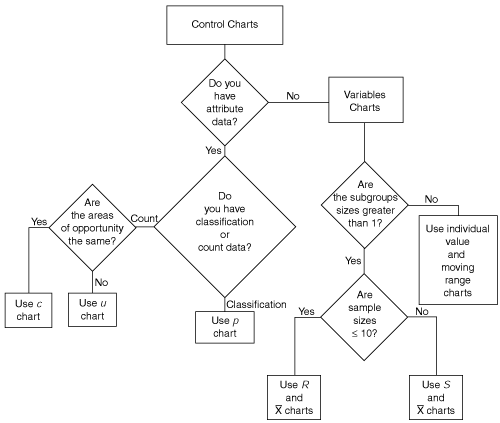
In this chapter, both attribute and variables control charts have been discussed. As a road map for this chapter, Figure 11.17 presents a flow diagram useful in selecting the control chart appropriate for monitoring your process.
Figure 11.17. Flow Diagram for Selecting the Control Chart Appropriate for Monitoring a Process

Get Statistics for Six Sigma Green Belts with Minitab and JMP now with the O’Reilly learning platform.
O’Reilly members experience books, live events, courses curated by job role, and more from O’Reilly and nearly 200 top publishers.

