6
The Normal Distribution
1 Probability Model for a Continuous Random Variable
2 The Normal Distribution—Its General Features
3 The Standard Normal Distribution
4 Probability Calculations with Normal Distributions
5 The Normal Approximation to the Binomial
*6 Checking the Plausibility of a Normal Model
*7 Transforming Observations to Attain Near Normality

Bell-Shaped Distribution of Heights of Red Pine Seedlings
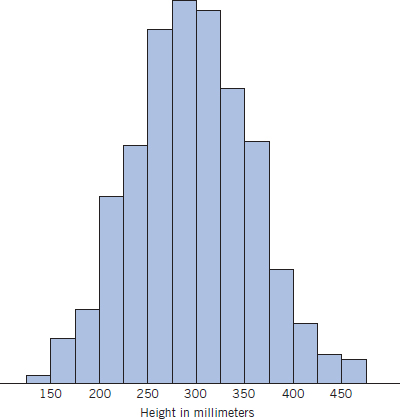
Trees are a renewable resource that is continually studied to both monitor the current status and improve this valuable natural resource. One researcher followed the growth of red pine seedlings.
The heights (mm) of 1456 three-year-old seedlings are summarized in the histogram. This histogram suggests a distribution with a single peak and which falls off in a symmetric manner. The histogram of the heights of adult males, or of adult females, has a similar pattern. A bell-shaped distribution is likely to be appropriate for the size of many things in nature.

1. PROBABILITY MODEL FOR A CONTINUOUS RANDOM VARIABLE
Up to this point, we have limited our discussion to probability distributions of discrete random variables. Recall that a discrete random variable takes on only some isolated values, usually integers representing a count. We now turn our attention to the probability ...
Get Statistics: Principles and Methods, 7th Edition now with the O’Reilly learning platform.
O’Reilly members experience books, live events, courses curated by job role, and more from O’Reilly and nearly 200 top publishers.

