8.1. Problem Articulation – Puzzling Dynamics of Oil Price
The long-term behaviour of oil price reveals striking contrasts between periods of price stability, mild price fluctuations, dramatic price surges and equally dramatic collapses. Figure 8.1 shows wellhead oil price in the USA spanning 135 years, from 1869 to 2004, a remarkably long time series. The vertical axis is on a scale from zero to 80 dollars per barrel in 2004 dollars. Lying behind this price trajectory is the turbulent history of the oil industry as vividly told in The Prize: The Epic Quest for Oil Money and Power (Yergin, 1991).
Between 1869 and 1880 there was extreme price volatility. This period corresponds to the early pioneering days of the oil industry in the Pennsylvania Oil Regions of the United States. The chaotic mix of speculators, fortune-seeking prospectors and their greedy exploitation of newly discovered reserves led to extraordinary periods of overproduction – too many wells and too much oil. The price trajectory in Figure 8.1 gyrates wildly, starting at $70 per barrel in 1869 and falling to only $15 per barrel in 1874. Over the next two years to 1876, the price rose dramatically to $40 per barrel before falling again to $15 in 1879. Then followed an interval of relatively low and stable oil price in the decade to 1889.
Figure 8.1. Historical oil price
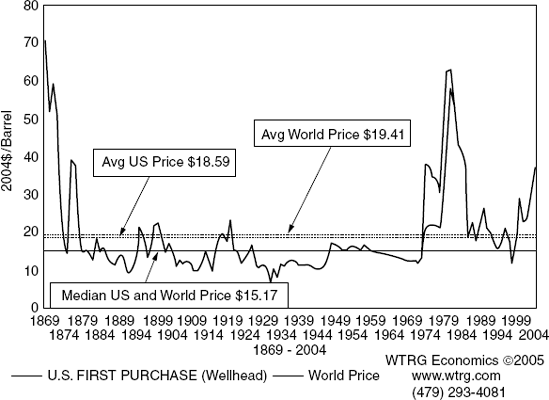
Source: WTRG Economics Copyright 2007. Reproduced ...
Get Strategic Modelling and Business Dynamics: A Feedback Systems Approach now with the O’Reilly learning platform.
O’Reilly members experience books, live events, courses curated by job role, and more from O’Reilly and nearly 200 top publishers.

