CHAPTER 16
CHAPTER 16 SOLUTIONS
16.1 SECTION 16.3
16.1 For Data Set B truncated at 50, the maximum likelihood parameter estimates are ![]() and
and ![]() , leading to the graph in Figure 16.1.
, leading to the graph in Figure 16.1.
For Data Set B censored at 1,000, the estimates are ![]() and
and ![]() . The graph is in Figure 16.2.
. The graph is in Figure 16.2.
For Data Set C, the parameter estimates are ![]() and
and ![]() . The plot is given in Figure 16.3.
. The plot is given in Figure 16.3.
16.2 For Data Set B truncated at 50, the plot is given in Figure 16.4. For Data Set B censored at 1,000, the plot is given in Figure 16.5.
16.3 The plot for Data Set B truncated at 50 is given in Figure 16.6. For Data Set B censored at 1,000, the plot is given in Figure 16.7.
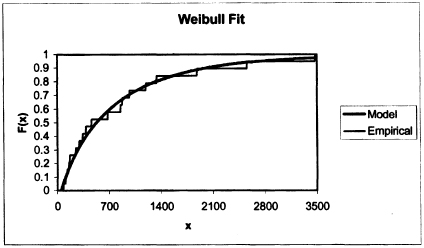
Figure 16.1 Cdf plot for Data Set B truncated at 50.
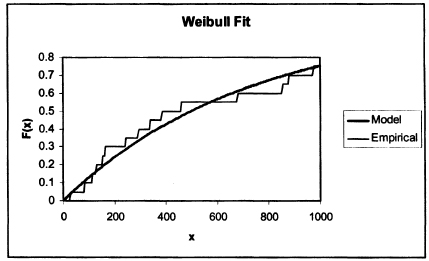
Figure ...
Get Student Solutions Manual to Accompany Loss Models: From Data to Decisions, Fourth Edition now with the O’Reilly learning platform.
O’Reilly members experience books, live events, courses curated by job role, and more from O’Reilly and nearly 200 top publishers.

