APPENDIX A
TABLES OF QUANTILES
Table A.1: Values of the cdf of the Standard Gaussian, to obtain the critical values of the Z-test
Table A.1 Values of the cdf of the Standard Gaussian: Φ(x).
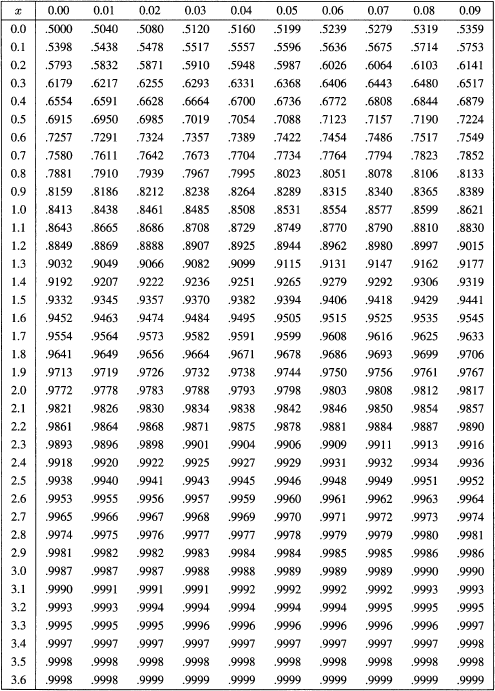
Table A.2 and A.3: Critical values of the t-test.
Table A.2 Critical values of the t-test, i.e. τ−1dfs(1 − α), with 10 ≤ dfs ≤ 40.
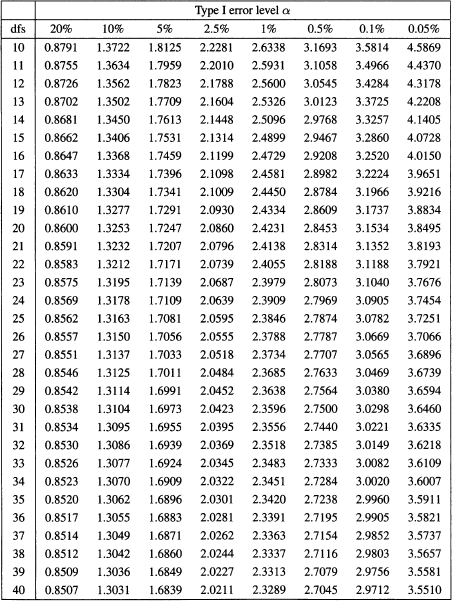
Table A.3 Critical values of the t-test, i.e. τ−1dfs(1 − α), with dfs ≥ 40.
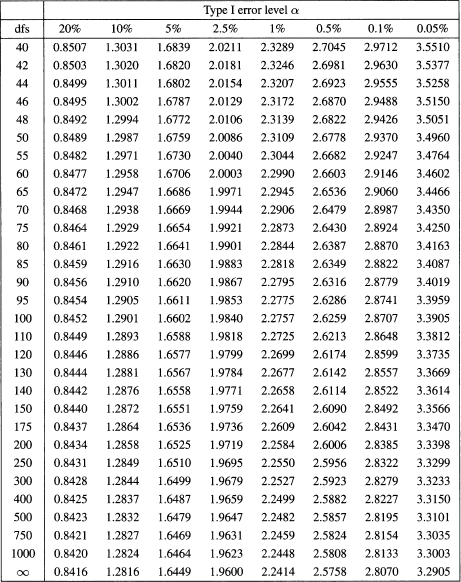
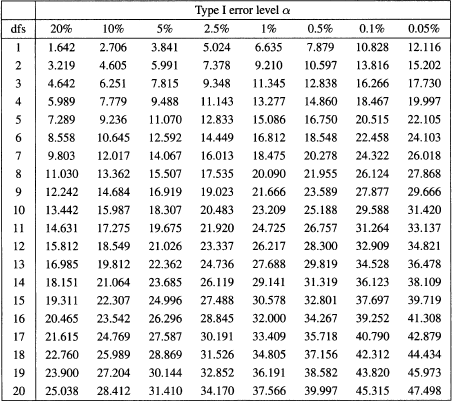
Table A.4: Critical values of the χ2-test.
Table A.4 Critical values of the χ2-test, i.e. ![]() .
.
Tables A.5 and A.6: Critical values of the Wilcoxon test, with m1 = m2, 120 being the maximum of m1 + m2.
Table A.5 Critical values of the Wilcoxon test, i.e. wm,1–α, with m1 = m2 = m, 10 ≤ m ≤ 40.
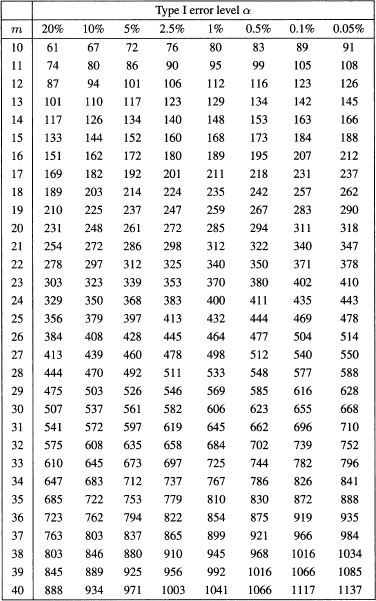
Table A.6 Critical values of the Wilcoxon test, i.e. wm,1−α, with m1 = m2 = m, 41 ≤ m ≤ 60.
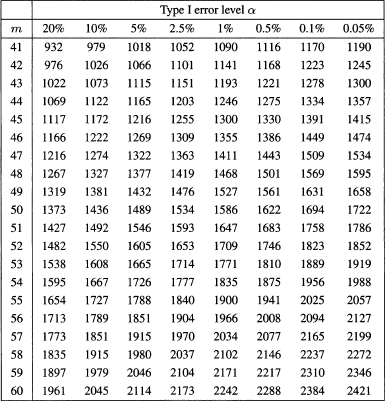
Table A.7: Critical ...
Get Success Probability Estimation with Applications to Clinical Trials now with the O’Reilly learning platform.
O’Reilly members experience books, live events, courses curated by job role, and more from O’Reilly and nearly 200 top publishers.

