APPENDIX B
TABLES OF RP ESTIMATES FOR THE ONE-TAILED Z-TEST
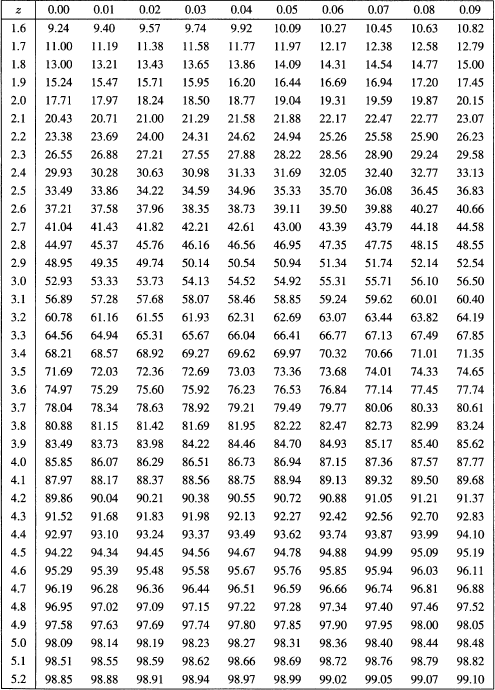
Table B.1: Values of the pointwise RP estimates, with α = 5%.
Table B.1 Values (%) of pointwise RP estimates with α = 5% (i.e. ![]() ), given the value z of the Gaussian test statistic.
), given the value z of the Gaussian test statistic.

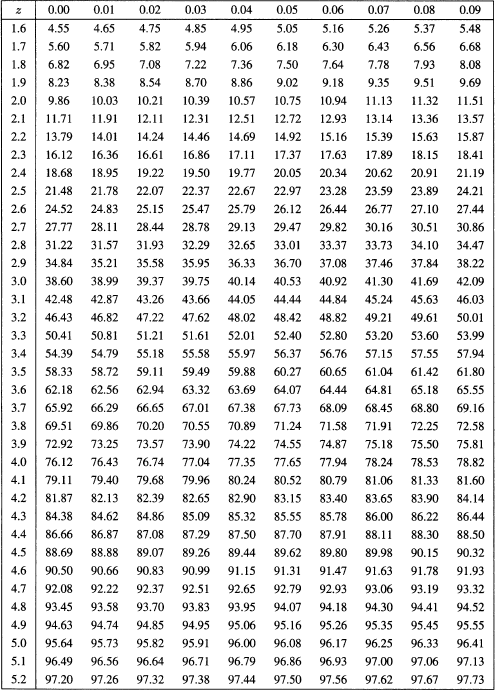
Table B.2: Values of the 90% conservative RP estimates, with α = 5%.
Table B.2 Values (%) of 90% conservative RP estimates with α = 5% (i.e. ![]() ), given the value z of the Gaussian test statistic.
), given the value z of the Gaussian test statistic.

Table B.3: Values of the 95% conservative RP estimates, with α = 5%.
Table B.3 Values (%) of 95% conservative RP estimates with α = 5% (i.e. ![]() ), given the value z of the Gaussian test statistic.
), given the value z of the Gaussian test statistic.

Table B.4: Values of the pointwise RP estimates, with α = 2.5%.
Table B.4 Values (%) of pointwise RP estimates with α = 2.5% (i.e. ![]() ), given the value z of the Gaussian test ...
), given the value z of the Gaussian test ...
Get Success Probability Estimation with Applications to Clinical Trials now with the O’Reilly learning platform.
O’Reilly members experience books, live events, courses curated by job role, and more from O’Reilly and nearly 200 top publishers.

