CHAPTER 15
Using Money Flow, Trend Lines, RSI, Stochastic, MACD, and Buy/Sell Signals to Rotate In and Out of Losers, with J.P. Morgan and Goldman Sachs Exhibits
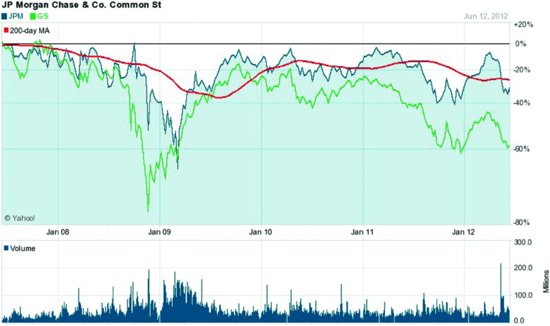
Why would anyone want to rotate in and out of losers? As Exhibit 15.1 for J.P. Morgan and Goldman Sachs shows, for the past 5 years, these stocks were losers. J.P. Morgan is a better loser than Goldman Sachs according to the chart. Portfolio managers must have a weighting in financials as required by diversification and risk management rules. They will overweight losers when they are bouncing up from the bottom. They will underweight losers when they start going down again. To help the portfolio manager and investor, we have to identify in this chapter the signals to buy the bounce and sell the top. The money flow index (MFI), Chaikin Money Flow (CMF), moving average convergence/divergence (MACD), stochastic, Keltner channels, and relative strength index (RSI) will all help the portfolio manager and investor to do this.
J.P. MORGAN AND GOLDMAN SACHS VERSUS THE REGULATORS
Banks were at the center of the financial panic that caused the 2008 stock market crash. We need to look at what technical analysis is currently telling us. Are these stocks showing the uptrends we look for in stocks? The world came very close to another Great Depression, saved by the ...
Get Successful Stock Signals for Traders and Portfolio Managers: Integrating Technical Analysis with Fundamentals to Improve Performance, + Website now with the O’Reilly learning platform.
O’Reilly members experience books, live events, courses curated by job role, and more from O’Reilly and nearly 200 top publishers.

