Creating an area chart
An area chart is very similar to a line chart (time series graph) with the area between the axis and the line shaded. A stacked area chart segregates the area, based on related categories. Area charts may allow trends to be more easily spotted because the eye focuses on a bigger area rather than comparing lines.
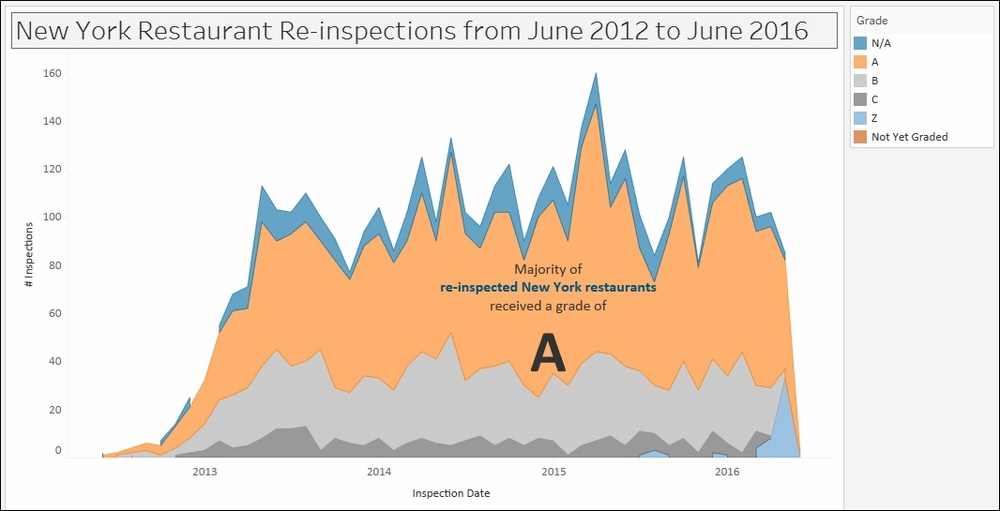
In this recipe, we will create an area chart that will show the results of restaurant re-inspections in New York City from June 2012 to June 2016.
Getting ready
To follow this recipe, open B05527_01 – STARTER.twbx. Use the worksheet called Area, and connect to the DOHMH New York City Restaurant data source.
How to do it... ...
Get Tableau 10 Business Intelligence Cookbook now with the O’Reilly learning platform.
O’Reilly members experience books, live events, courses curated by job role, and more from O’Reilly and nearly 200 top publishers.

