Creating a histogram
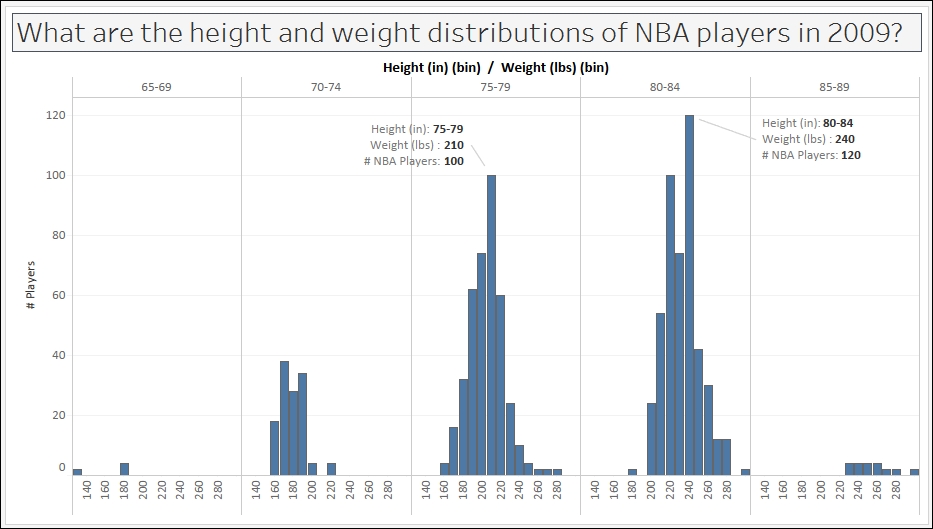
Histograms are graphs that plot frequency distribution of data.
In this recipe, we will create a histogram that will visualize what the most common heights and weights are of NBA players, based on a 2014 NBA player's stats data source.
Getting ready
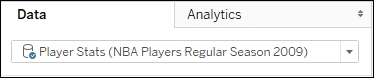
To follow this recipe, open B05527_02 – STARTER.twbx. Use the worksheet called Histogram, and connect to the Player Stats (NBA Players Regular Season 2009) data source.
How to do it...
The following are the steps to create the histogram in this recipe:
- Under Measures, right-click on Height ...
Get Tableau 10 Business Intelligence Cookbook now with the O’Reilly learning platform.
O’Reilly members experience books, live events, courses curated by job role, and more from O’Reilly and nearly 200 top publishers.

