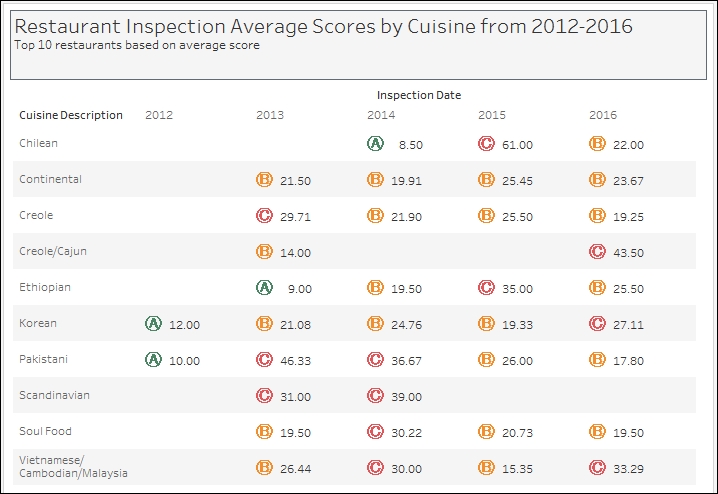
Creating a KPI text table
Key performance indicators, or KPIs, are metrics that indicate how well an organization is performing against its objectives. KPIs are typically represented as easily understandable color-coded symbols in a dashboard. For example, a red circle could mean that area is not meeting objectives, while a green circle does.
In this recipe, we will show the top 10 New York restaurant cuisines based on their average inspection scores from 2012-2016 in a text table with KPIs.

Getting ready
To follow this recipe, open B05527_02 – STARTER.twbx. Use the worksheet called KPI Text Table, and connect to the DOHMH New York City Restaurant ...
Get Tableau 10 Business Intelligence Cookbook now with the O’Reilly learning platform.
O’Reilly members experience books, live events, courses curated by job role, and more from O’Reilly and nearly 200 top publishers.

