Creating story points
Story Points allow us to organize our topics and views into a sequence of points that aid in presenting data. Story Points can leverage any views or dashboards in the workbook and use any of those in each point.
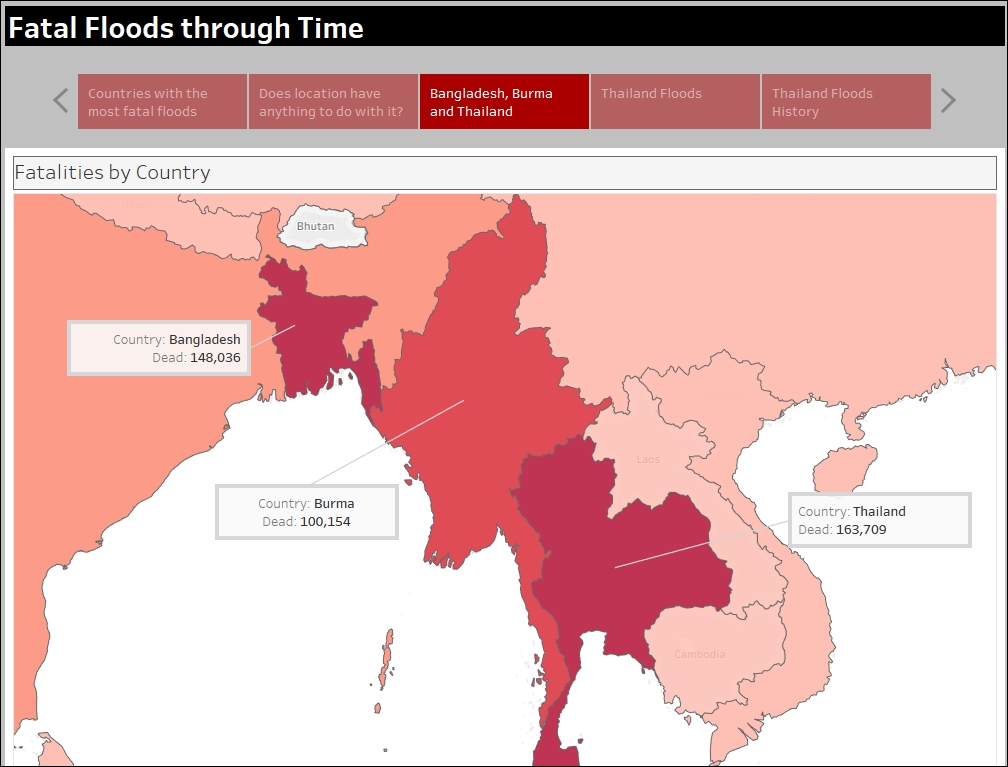
In this recipe, we will explore where fatal floods have happened over time using Tableau's story points.

Getting ready
To follow this recipe, open B05527_04 – STARTER.twbx. We will use the following worksheets:
- Fatalities by Country
- Fatalities by Country Map
- Flood History by Country
We are also going to use the following dashboard which shows Thailand Floods data:
How to do it...
The following are the steps to create the story ...
Get Tableau 10 Business Intelligence Cookbook now with the O’Reilly learning platform.
O’Reilly members experience books, live events, courses curated by job role, and more from O’Reilly and nearly 200 top publishers.

