Go ahead and open the Chapter 02 Starter.twbx workbook located in the \Learning Tableau\Chapter 02\ directory and navigate to the Tableau Paradigm sheet. Take a look at the view that was created by dropping the dimension Region on Columns and the measure Sales on Rows:
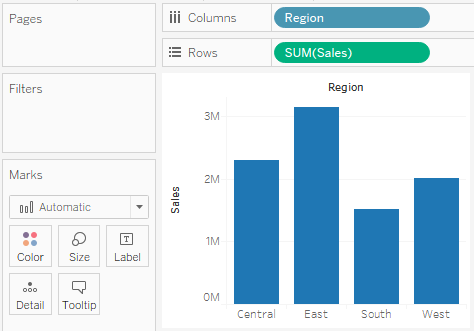
The Region field is used as a discrete (blue) field in the view and it defines the Columns headers. As a dimension, it defines the level of detail in the view and slices the measure. The Sales field is a measure that is being aggregated by summing up each sale within each market. As a continuous (green) field, Sales defines an axis.
You do not need to understand ...

