We'll consider another example dashboard which demonstrates slightly different objectives. Let's say everyone in the organization has agreed upon a key performance indicator of Profit Ratio KPI. Furthermore, there is consensus that the cut-off between an acceptable and poor profit ratio is 15.00% but management would like to have the option of adjusting the value dynamically to see if other targets might be better.
Consider the following dashboard:
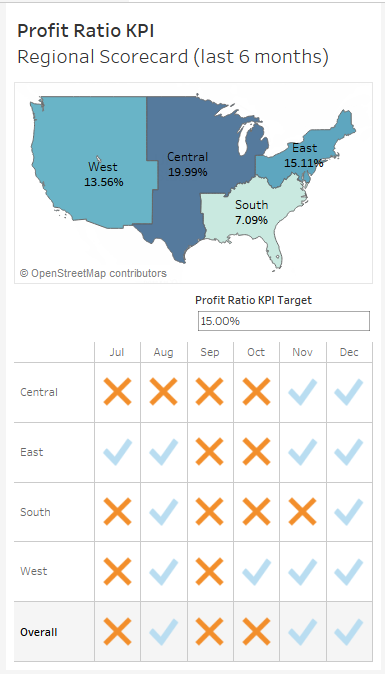
This dashboard allows your audience to very quickly evaluate the performance of each region over the last 6 months. Executive management could very quickly pull this ...

