Now that we know all about Tableau's analytical tools, let's see whether we can solve this sample exam question:
Which subcategories in the LATAM market are more than a standard deviation away from the mean for both sales and profit?
We can answer this question in two ways.
First, we can go with the previous chapter and use INCLUDE statements to show the average and standard deviation of the sum of the two measures. Here, we will define {INCLUDE [Sub-Category]: SUM([Profit])} and {INCLUDE [Sub-Category]: SUM([Sales])} and look at the average and standard deviation of each, as follows:
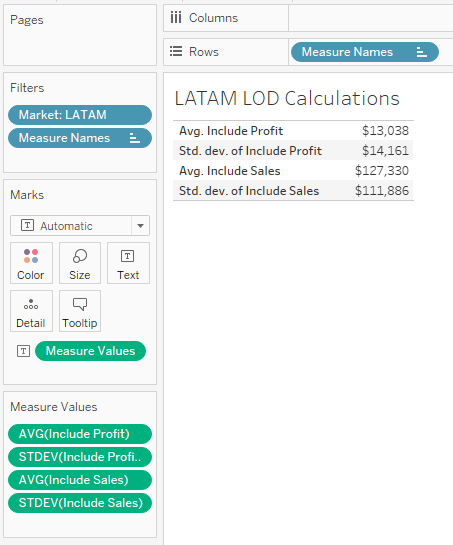
By performing some simple additions, ...

