Chapter 11. Circles, Shapes, and Pies
Circle, Shape, and Pie are all mark types on the Tableau Marks card. The chart type you choose will depend on your use case. Throughout this chapter, I’ll show you how to use the Circle and Shape mark types and how to create pie charts.
11.1 Scatter Plot
When you want to compare two continuous measures, you might want to use a scatter plot. This allows you to see if there is a relationship between the two variables.
Problem
You want to compare sales and profit by customer.
Solution
-
Drag Sales onto Rows and Profit onto Columns:

-

This will show a single mark in the view because Tableau automatically aggregates the view to Sum of Sales and Sum of Profit. It should look like this:
-

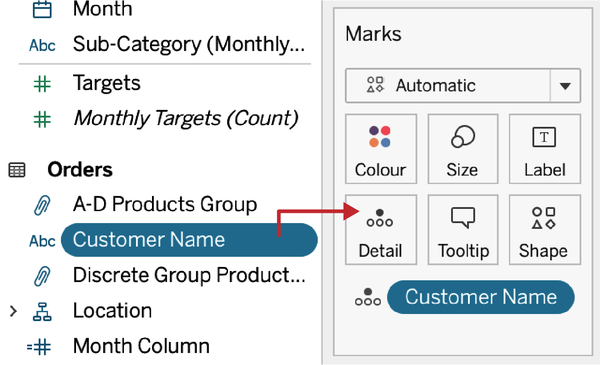
To break this down by customer, add Customer Name onto the Detail property of the Marks card:
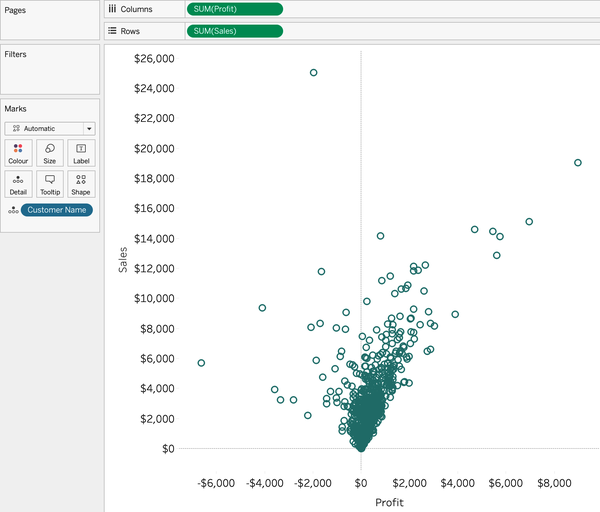
Your final view should look like this:

Discussion
A scatter plot is good for comparing two measures. Each mark on the scatter plot allows you to see the sales and profit per individual customer. Holistically, a scatter plot allows you to compare both measures ...