Chapter 14. Pivoting Rows to Columns
In the previous chapter, we covered the first type of pivoting: columns to rows. In this chapter, we will look at pivoting data in the opposite direction—rows to columns (sometimes known as unpivoting). First we’ll look at when to pivot rows into columns and then how to actually apply this technique in Prep Builder.
When to Use a Rows-to-Columns Pivot
The Rows to Columns pivot option was added to Prep Builder in a later version of the tool, and it was a welcome addition to avoid a workaround for a common use case. Data frequently comes from sources where multiple measures or dimensions are held in a single column. To make analysis easier in Tableau Desktop, you need to separate these out into an individual column per measure or dimension. If you don’t separate them, it is technically still possible to analyze the data in Tableau Desktop (Figure 14-1).
However, if you want to create a scatterplot comparing two metrics, you can’t do so without creating multiple calculations, or duplicating data fields and filtering them. Remember, the aim of data preparation is to make the analysis easier for end users.
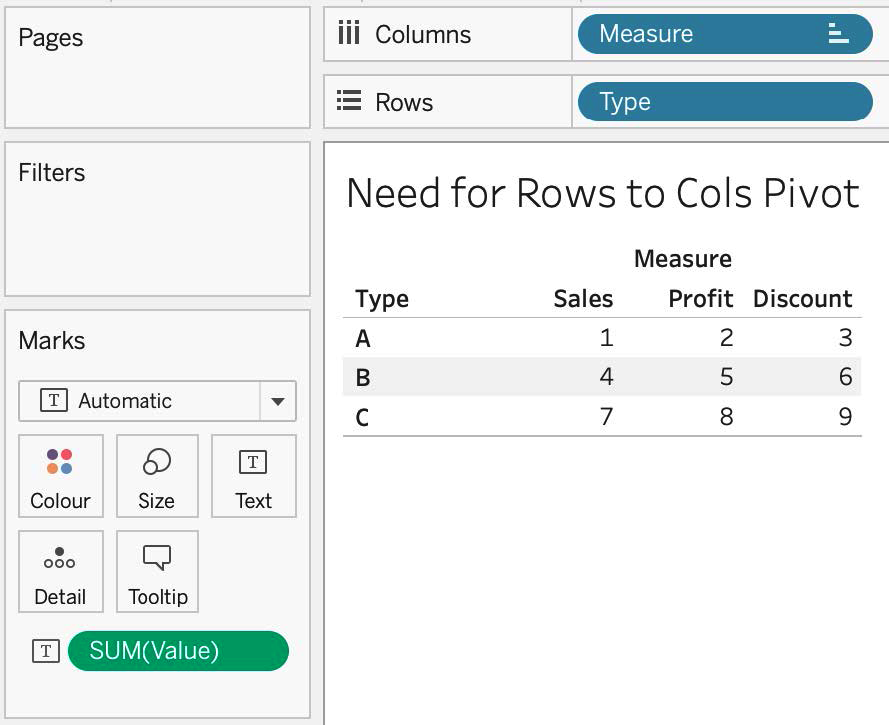
Figure 14-1. Visualizing the single data field of metrics
Figure 14-2 shows the visualization we want to achieve.
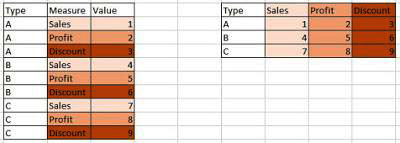
Figure 14-2. The data visualization ...
Get Tableau Prep: Up & Running now with the O’Reilly learning platform.
O’Reilly members experience books, live events, courses curated by job role, and more from O’Reilly and nearly 200 top publishers.

